Lenses and Optics
There is No Perfect Lens
The Three Questions
I get asked a couple of questions every time I publish a graph showing Imatest results for multiple copies of lenses like the one below. Most people understand that some copy-to-copy variation is inevitable in the manufacturing process. Most are surprised, though, at how large the sample variation seems to be. Heck, I was surprised at how large the sample variation was when I started doing this kind of testing.
The three questions I get asked over and over are the same questions I asked myself when I first started seeing these results:
- Are you sure the variation is that great?
- Can you really see the difference in a photograph?
- Can optical adjustment make the copies with the worst results better?
1: Sample Variation is Real
Most of us are aware that there has to be some variation between lenses, since we all know every manufacturing process has variability. But it was comforting to think that lenses were all the same because it would make life simpler. Reading lens reviews, for example, is a lot simpler if we can just go to our favorite site, rather than try to average out the results of half-a-dozen reviews to get a mental picture of what the lens is like.
The graph below provides a good example. It shows the Imatest MTF50 results for Canon 24-70 f/2.8 Mk II lenses and 70-200 f/2.8 Mk II IS lenses at 70mm. If you go online to any forum you can find multiple-page debates about which is sharper. If you average each lens together, the 24-70 would win by a hair. But it wouldn’t be a significant win, really. If you pick one copy of each lens at random, chances are about 60% that you’d find the 24-70 f/2.8 a bit sharper with meticulous, pixel-peeping numerical tests. So it’s not shocking that a number of the people who talk about the two lenses say their 70-200 f/2.8 IS II was at least equal to, if not sharper than the 24-70 Mk II. Those reviewers aren’t incompetent. It’s just the statistical laws of sampling at work.

I have a scientific background, so my first thought when seeing more variation than expected was our testing methods weren’t accurate. So we refined testing methods, eliminated bad copies, and tested only new copies. The variation was still there.
It didn’t matter what brand, there was similar sample variation. It was a bit greater in wide-angle lenses and zooms, less in prime lenses and telephotos. But whenever we tested a significant number of copies, we saw similar variation.
Like most people testing lenses, we used Imatest. But maybe a lens-test projector would be better. Nope. Well, the gold standard was MTF measured on an optical bench. So we (despite the vigorous protestations of those-who-manage-the-money) bought an optical bench. It showed a similar amount of copy-to-copy variation. (The optical bench might make it sound better, though. It’s amazing the number of people who think the difference between 0.65 and 0.70 on a zero to one scale is ‘about the same’, while they think the difference between 650 and 700 on a one to one thousand scale is hugely different.)
2. Can You Really See the Difference?
This is where things get gray, rather than black and white. The answer is it depends on two things.
The first part is which copies you looked at. Obviously the difference between the very best and very worst copies in each group are going to be more significant than one of the ‘pretty good’ and ‘pretty bad’ copies. Chances are if you just picked any two of the lenses from the graph above you would be hard pressed to find the difference.
The second thing is obviously how closely you look. If we take the best and worst 70-200 lenses above and make online jpgs to show our friends, chances are very high we could see no difference even between the best and worst copies. Even a small print probably would not show a difference. In a large print (say 20 X 30 inches) or at 100% pixel peeping we could see the difference between the best and the worst copies. We might even be able to differentiate between one of the top 20% copies and one of the worst 20% copies if we compared two shots side-by-side.
For the vast majority of copies, though, we couldn’t really tell in a photograph. The numbers seem quite different, but the photographs don’t. (For more detail, you can read this article.)
3: Lenses Can Be Optically Adjusted
When you test several-thousand heavily used lenses, you find a lot of optically bad lenses (NOTE: A bad lens is outside the range described by sample variation. It’s much worse. On the graph above a bad copy would be way down in the lower left corner or even off the chart.) Over time we learned that there were adjustable elements in most lenses that could be used to correct optical problems in many of these bad copies.
We learned how to do a lot of those adjustments ourselves. Partly because that’s how we’re wired; we just have to know. Partly because fixing things in-house lets us get it back in stock in days, while sending it off for service may take weeks. And partly because we learned that while the service centers are absolute wizards at fixing a burnt-out autofocus motor or adjusting electronic focus, they aren’t always that great at optically adjusting lenses.
Eventually, we got to the point where with some lenses we could do a better job than the factory. Don’t get me wrong; it wasn’t because we knew more. It was because we were willing to spend hours meticulously adjusting-measuring-adjusting-measuring a single lens. In at least some cases, it was because we had better measuring and testing equipment than the service center did.
I guarantee you the factory is a lot faster than we are. But I also know any service center’s goal is to get the repair done as quickly as possible. Time is money. So spending the time we were willing to spend gave us a big advantage.
But There Are Limits
Anyway, we could take an optically bad lens (most of them, anyway) and get it right back up to the pack with the others of its kind.
But what we aren’t able to do is to take the lowest 10 or 20 lenses in a test sample like the one above and make them better; at least not consistently. In other words, we can usually make a really bad lens adequate, but we can’t usually make a slightly below average lens better. We’ve spent a lot of time trying to figure out why that is.
The Causes of Optical Imperfection
We know when a lens designer finishes designing the lens; he or she has mathematically calculated what the optics will be like (and the manufacturer, with one or two exceptions, prints out the MTF charts from those mathematical calculations). The calculations assume each element is in absolutely correct position.

One of the other steps in lens design is ‘tolerancing’; that is, determining how much the inevitable small variations between the theoretical design and the actual manufactured product will affect the lens. It may be found that a tiny variation in one element would cause a huge change in the optical characteristics of the lens. At this stage the designer, knowing such manufacturing precision is impossible, might trade off losing a bit of resolution or a slightly increased aberration for a more realistic tolerance that could actually be manufactured.
Later in the design process ‘cost tolerancing’ comes into play. While we don’t know the exact tolerances and acceptable costs for the various manufacturers, we do know that a more precise the tolerance results in a big increase in cost. Jenoptik (manufacturer of precise laboratory grade lenses), for example, states their high quality lenses cost 2 to 4 times as much as a standard manufacturer’s lens. Their highest quality (and they make stuff for satellites and the military) costs 10 to 100 times as much as a standard quality lens.
For those of you who like to avoid reality, let me be very clear. There is no such thing as zero tolerance. Not if you measure accurately enough. If you want the very best quality obtainable, then a nice f/2.8 zoom would be priced at $20,000 to $40,000. What a coincidence — that’s about the price range of cinema-quality zooms.
The bottom line is when each copy of the lens is actually assembled there are tiny variations in the placement of each element, the curvature of each element, even in the refractive index of each element. The diagram below shows the common variations in element placement that occur when a lens is actually manufactured (greatly exaggerated).

- The common variations in element placement that occur in a ‘real’ lens: 1) Spacing error, 2) Centering error, 3) Tip (or tilt)
Every single element in the lens will have some manufacturing variation. For example, let’s just consider the rearmost group, a cemented doublet. Here are the tiny errors that will (to some small degree) occur in every copy:
- The refractive index of the glass used varies a bit in every batch of glass, for each of the two elements.
- The curvature of the elements when they are made and polished may be a tiny bit different (on each of the two surfaces for each element).
- The gap where they are cemented together may be a bit thicker or thinner than the theoretical design.
- The elements may be cemented together a bit off-center.
- When mounted in the lens, the cemented group may be slightly off center, slightly tilted, or have a slightly incorrect space between it and the element in front of it.
That’s just the rear cemented doublet. We have to repeat those errors for each element and group when we consider the entire lens.
The Mathematical Difference Between ‘Bad Lens’ and Variation
Earlier I mentioned that if we test a large group of lenses we see there’s a fair amount of variation in the good copies, but the bad copies are much different. Here’s a good example of the difference as seen on Imatest:
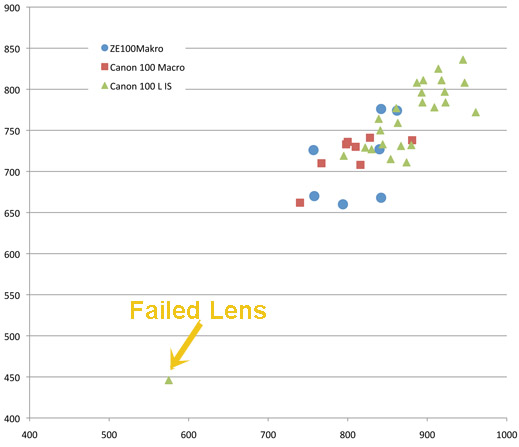
Most of the lenses are in a fairly tight group, the really bad lens optically is quite apparent. It’s nice when we can show mathematically why that would be the case.
The total error of the lens (the effect of all of those tiny manufacturing errors discussed above) is expressed as the “root sum square” (RSS). The math is pretty simple; you square all of the errors of a given type, add the squares together, and then take the square root of the total. That’s how far off the entire lens is from theoretical perfection.
For example, if we have a 9-element lens, and every element is off center by 2 microns, then the root sum square for the entire lens would be ?(9 x 22), which equals 6. If we reduce the error of each element to 1.5 microns, the RSS would be reduced to 4.5. If we increased the error of each element to 2.5 it would increase the RSS to 7.5.
But if we get one element way out of position, lets say 7 microns, while all the others remain at 2 microns, the RSS jumps to 9. That’s exactly the same RSS we would get if every single element were 3 microns off-center.
If we assume the quality assurance at the factory could detect / correct centering variations of 2.5 microns or less, than the worst total RSS the lens could have would be 7.5 from the tiny manufacturing variations inevitable in each element. That’s the worst case scenario, an actual copy of the lens would probably be a lot less than that.
But just one element with a large centering variation that got through quality control would make a bad copy, one with an RSS much larger than 7.5.
Of course, this is a massive simplification. (I’m making these numbers up as an example – there’s no way a manufacturer could be this accurate at a reasonable cost.) In reality there is more going on at each element than just centering. If an element was really misplaced it would have a large effect on centering, tilt, and perhaps even spacing. Plus, certain elements in the lens are critical elements and a variation in those may have a greater effect than one involving another element.
But the basic theory is the same: a lot of small imperfections in the various elements add up to cause a small imperfection in the lens. One element with a large imperfection can cause a large imperfection in the lens.
It seems reasonable to assume that quality control and manufacturing precision can usually prevent the large problems causing a ‘bad lens’. It is impossible, at anything like a reasonable cost, to prevent the multiple small imperfections that create copy-to-copy variation.
Optical Adjustment
We know that most lenses have 2 or 3 elements that can be adjusted after assembly. For example, an element may be shimmed or placed on an adjusting ramp so that the spacing between it and other elements can be changed.

- An element placed on a ramp so that rotating it changes the spacing between it and other elements.
Another element may be held in place by eccentric (oval shaped) collars. Rotating the collars changes tilt and / or spacing of the element.

- Rotating this oval brash washer tilts one side of the element up or down
Or, an element may also be placed on a plate so it can be slid from side to side to center properly.

- Loosening the aluminum ring allows the lens element to slide a bit for centering.
So this should let us fix those minor problems that are inevitable during assembly, right? Not so fast.
Lenses have just a few adjustable elements; most elements can’t be adjusted at all. Some lenses have no adjustable elements; the various elements are fixed permanently as the lens is assembled so what you get is what you get.
Additionally, an adjustable element might be only tiltable, only centerable, or movable for spacing. Occasionally one element may have more than one correction. (The Canon 24-70 f/2.8 MK I front element, for example can be centered, tilted, and moved up or down.)
If we perfectly position those adjustable elements for centering, tilt, and spacing, will we end up with a better lens? Perhaps if we could position them with near-perfect accuracy we could reduce the amount of sample variation. There are certain pieces of testing equipment that can evaluate centering, tilt, and even spacing of the various elements within a lens. They’re expensive, but if they could simplify and improve the process of optically adjusting a lens, they might be worthwhile.
So over the last couple of months, we’ve investigated how much improvement we could make in various lenses using the best equipment we could find to perfectly center those elements that were adjustable.
The Results
I won’t bore you with all the details of playing with various 6-figure pieces of optical testing equipment, other than to tell you with such equipment we were able to take some sample lenses and put the adjustable elements in mathematically near-perfect alignment. Guess what happened?
Below is an imatest printout of a good lens. It has a bit of astigmatism, but overall slightly above average Imatest results compared to other copies.

After using some amazing machinery to perfectly center the adjustable elements, we ended up with this:

After adjustment the center point has higher resolution and lower astigmatism. But resolution in the right side has been markedly reduced and astigmatism increased.
This is one example, but we’ve dozens of others. Sometimes, like this one, we would get a lens with an extremely sharp center but at the price of much weaker corners. Or we might improve resolution, but at the cost of increased astigmatism. Getting maximum resolution at the long end of a zoom may soften the short end a bit. Getting the corners as even as possible may give up some center resolution.
I should have realized this was the case when I found that most manufacturers identify what I’ve been calling ‘adjustable elements’ as ‘compensating elements’. Adjustment is not supposed to exactly center and align this element; rather it must be slightly out of position to compensate for the inevitable manufacturing tolerances of the other elements. It’s adjusted to give a ‘best overall result’ by compensating for the tiny errors in the rest of the lens.
This means that each lens, adjusted as well as possible, still isn’t perfect. And it will be slightly different from others of it’s kind. Measured carefully enough, one copy might have a bit softer corner, another is a bit softer at one end of the zoom range, this one might have a bit more astigmatism, while that one has a bit higher center resolution.
Does it make a difference when you’re taking pictures? Rarely, but it can happen. Remember, a badly out of position element causes a huge difference in the lens’ optics. The many small variations cause only minor differences. They probably will only be apparent with careful measurement using testing equipment, or severe pixel peeping.
The Good News
The laws of physics, manufacturing tolerances, and simple economics mean sample variation can never be entirely eliminated. Scream all you want about how you expect a perfect lens, but unless you’re willing to pony up $20,000 to $40,000 per zoom, you aren’t even going to get into the neighborhood of near-perfection.
There is good news, though, and it makes a lot of sense. In earlier posts I’d shown that for most lenses, the sample variation is generally right about at the limits of what we could detect visually in a photograph. That makes perfect sense. Lens designers are pretty smart guys and manufacturers are going to keep a pretty tight grip on costs. The logical place to keep sample variation would be where you can hardly see it.
Historically, that was more than fine. In film days, not many people would take 1,000 test target shots and print the images to maximum size to see if they had a great copy. Of course, digital changed all of that.
Crunching numbers, especially the big numbers that we get when testing lenses, makes the variation seem huge. The difference between 800 and 900 line pairs per image height must be noticeable, right? That’s a huge difference. But the truth is it’s not usually visible in a photograph, even a large print photograph.
Sure, if we pixel peep and analyze we can find that this copy has a better number in the center than that copy. But if we look closer, that copy might be better in the corners, or may have less astigmatism. Or that copy may have better acutance or less flare. In general the difference in copies that looks so impressive when charted numerically in a graph, or when this reviewer says 800 line pairs and the other reviewer says 750, is insignificant.
Not to mention there’s a lot more to it than just the resolution numbers we spout off in our lens reviews. Few reviewers give astigmatism numbers, or do careful flare testing, or measure actual light transmission. And all the numbers in the world can’t tell you what a picture taken with the lens looks like.
As to improving sample variation, I’m not ready to give up on that quest yet. There are a number of tools and techniques we’re exploring. But the laws of physics and economics mean it can’t be eliminated entirely.
References:
Geary, J: Introduction to Optical Testing. SPIE Press, 1993.
Ishikkie, M, et al: Lens Design: Global Optimization of Both Performance and Tolerance Sensitivity. SPIE International Optical Design Conference, 2006.
Malarca, D: Optical Shop Testing. Wiley and Sons, 2007.
Schwertz, K and Burge, J: Field Guide to Optomechanical Design and Analysis. SPIE Press, 2012.
Schwertz, K: Useful Estimations and Rules of Thumb for Optomechanics. University of Georgia, 2010
Smith, Warren J. Modern Optical Engineering: the Design of Optical Systems. McGraw Hill, 2000.
Youngworth, R: The Continual Evolution of Tolerance Assignment in Optics. SPIE, 2009.
Roger Cicala
Lensrentals.com
September, 2013
Author: Roger Cicala
I’m Roger and I am the founder of Lensrentals.com. Hailed as one of the optic nerds here, I enjoy shooting collimated light through 30X microscope objectives in my spare time. When I do take real pictures I like using something different: a Medium format, or Pentax K1, or a Sony RX1R.
-
MarcosV
-
Rck
-
Yoda
-
Mika
-
bison
-
Ken Phillips
-
Virginia
-
TigerBalm
-
mike
-
TBannor
-
Aaron Shepard
-
François
-
Mowl
-
Rob S.
-
Stephan Kuhn
-
Stephan Kuhn
-
Claudio Costerni
-
shorebreeze
-
Mika
-
Nqina Dlamini
-
WT21
-
Ilkka Nissilä
-
Stefan Janse Van Rensburg
