Technical Discussions

Good Vibrations: Designing a Better Stabilization Test (Part I)

Published July 30, 2013

My name’s T.J. Donegan, I’m the Editor-in-Chief of DigitalCameraInfo.com and CamcorderInfo.com (Soon to just be Reviewed.com/Cameras). We recently wrote about designing our new image stabilization test for our Science and Testing blog. I showed it to Roger and he asked for the “nerd version.” He was kind enough to let us geek out about the process here, where that kind of thing is encouraged.


DigitalCameraInfo.com’s latest image stabilization testing rig. (In beta!)


Since the beginning of DigitalCameraInfo.com and CamcorderInfo.com, we’ve always tried to develop a testing methodology that is scientific in nature: repeatable, reliable, and free from bias. While we do plenty of real-world testing during every review, the bedrock of our analysis has always been objective testing.

One of the trickiest aspects of performance to test this way is image stabilization. Things like dynamic range, color accuracy, and sharpness are relatively simple to measure; light goes in, a picture comes out, and you analyze the result. When you start introducing humans, things get screwy. How do you replicate the shakiness of the human hand? How do you design a test that is both repeatable and reliable? How do you compare those results against those of other cameras and the claims of manufacturers?


Our VP of Science and Testing, Timur Senguen Ph.D., shows our new image stabilization testing rig in action.

It’s a very complex problem. The Camera & Imaging Products Association (CIPA) finally tried to tackle it last year, drafting up standards for the manufacturers to follow when making claims about their cameras and lenses. We’re one of the few testing sites that’s taken a crack at this over the years, attempting to put stabilization systems to the test scientifically. Our last rig shook cameras in two linear dimensions (horizontally and vertically). It did what it set out to do—shake cameras—but it didn’t represent the way a human shakes. Eventually we scrapped the test, tried to learn from our experiences, and set out to design a new rig from scratch.

Shake, Shake, Shake, Senora

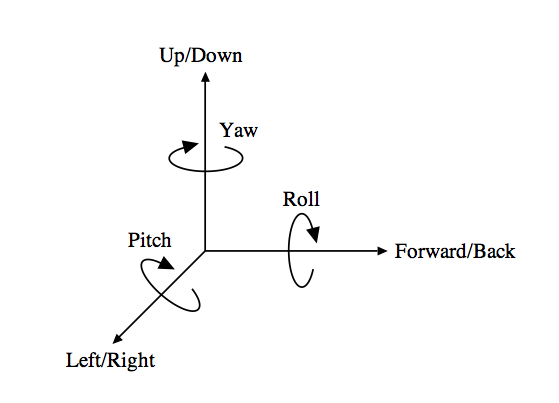
Our VP of Testing and Science, Timur Senguen, Ph.D. (We just call him our Chief Science Officer, because we’re a bunch of nerds) wrote up an Android application that would use the linear accelerometers and gyroscope in an Android phone to track how much people actually shake when holding a camera. This allows us to see exactly how much movement occurs in the six possible dimensions—both linear (x, y, and z) and rotational (yaw, pitch, and roll).


In three-dimensional space there are six possible axes of movement. Timur tried to account for time travel, but we had to hold him back.


Using the program on an Android phone we tested the shaking habits of 27 of our colleagues, using a variety of grip styles and weights across the camera spectrum. We tested everything from the smartphone alone up to a Canon 1D X with the new 24-70mm f/2.8L attached to see how people actually perform when trying to hold a camera steady. (The 24-70mm isn’t stabilized, but this was just designed to be representative for weight and grip style.)

You can actually play along at home here if you like. Timur’s .apk is available here, which you can install on any Android phone and run yourself. You can hold the phone like a point-and-shoot, or you can do what we did and attach the phone to the back of a DSLR to get data on how much you shake when using a proper camera and grip (to keep the weight as close as possible, remove the camera’s battery and memory card). When you’re done you can send your results to us with the name of your camera and lens and we’ll use your data for future analysis. Bonus points if you jump in the line and rock your body in time. (Sorry, I had to.)

Roger’s Note: One of the reasons I’m very interested in this development is this: my inner physician is very aware that type, frequency, and degree of resting tremor varies widely in different people, especially with age. A larger database of individual’s tremor might help identify why some people get more benefit out of a given IS system than others – and hopefully some day you’ll be able to use an app like this to define your own tremor and then look at reviews to see which stabilization system is best matched for it. Or even adjust your system’s stabilization to best match your own tremor (we all have one) like we currently adjust microfocus. So I encourage people to download the app and upload some data. 


Timur designed an Android application that would track the linear and rotational movement produced by the human hand when holding a camera.


What we found is actually quite interesting. First, people are generally exceptional at controlling for linear movement (up and down, side to side, and forward and back). We are about ten times worse at controlling for yaw and pitch (the way your head turns when you shake your head “no” or nod your head “yes”). We are about roughly four times worse at controlling for steering wheel-type rotation, which you can fix with any horizon tool on your computer.

We also found that weight is not actually a huge factor in our ability to control camera shake. The difference between how we shake a 2300 gram SLR like the 1D X and a 650 gram DSLR like the Pentax K-50 is actually very minimal. It passes the smell test: When you’ve got a hand under the camera supporting it, you’re going to have a limited range of motion; when you’re holding a point-and-shoot pinched between your thumbs and index fingers, you have no support and thus shake significantly more, even though the camera weighs significantly less.

Our findings also showed that, for yaw and pitch, we typically make lots of very small movements punctuated by a few relatively large ones. When we plotted the frequency of shakes against severity, we got a very nice exponential decay curve. All of our participants produced a similar curve, with experienced photographers (and the uncaffeinated) having a slight advantage.


Our data showed that the typical person produced a lot of very small movements (the left side of the graph) with a few very large movements (the right side).


Once we had our sample data, it was a simple matter of building the rig. (At least Timur made it look simple. I don’t know. He built it in two days. The man’s a wizard.) His rig is designed to accommodate all six axes of movement, though based on our findings we stuck with just yaw and pitch since they’re the only significant factors. While Olympus’ 5-axis stabilization is intriguing (and likely better if you have a condition that causes linear movement, such as a tremor), the limited linear movement we subject cameras to only really makes a difference at extreme telephoto focal lengths. We then tested the rig using the same Android application that we used for our human subjects and fine-tuned the software so that the rig accurately replicated the results.

With our rig built and calibrated, we then had to design a testing methodology. We first looked at the standard drafted by CIPA last year. They confirmed our primary findings—that yaw and pitch are the main villains of camera shake—but we took issue with some of their methods.

First, they use two different shaking patterns based on weight (one for cameras under 400 grams, one for cameras over 600 grams, they use both if it falls in the middle), which we found wasn’t a contributing factor in camera shake. We have two shake patterns, but one is reserved just for smartphones and gripless point-and-shoots, regardless of weight.

For actual analysis, they also use a very high-contrast chart and a rather obtuse metric they devised, which translates as “comprehensive bokeh amount.” You can read all about it here. It’s fairly convoluted, and we ultimately decided to not go that way.

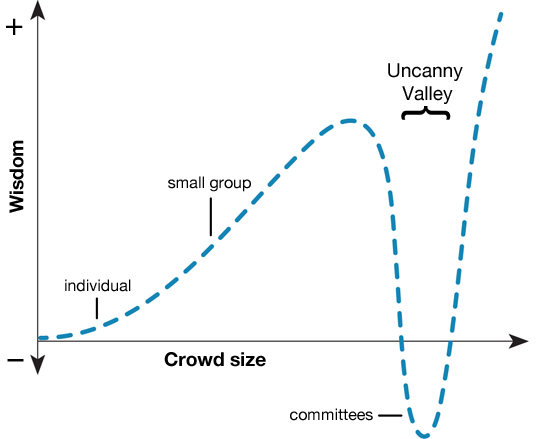
The CIPA standard does actually have quite a bit going for it, especially for something that came out of a committee. (If there’s wisdom in crowds, then committees are the uncanny valley.)  It’s certainly far better than the convoluted battery test, which calls for fun things like always using the LCD as a viewfinder, turning the power off and on every ten shots, moving through the entire zoom range whenever you turn the camera on, and basically all the things you never actually do with your camera. This is what usually happens when 27 engineers from 19 different companies try to come to a consensus.


When you get a lot of very smart people in a room, they tend to make puzzling decisions.


We primarily use Imatest for our image analysis, so we’ve settled on a methodology that closely aligns with the one outlined here, by Imatest’s creator, Norman Koren. It involves looking at the detrimental effect that camera shake has on sharpness, using the slanted edge chart that we already use for resolution testing.

We’re still in the process of beta testing our rig, but we’ve begun collecting data on cameras we have in house. We’re not yet applying these results in our scoring, but we’ll be back soon to describe some of our findings in part II.


T. J. Donegan

July, 2013

Author: tjdonegan

Posted in Technical Discussions
  • xv

    Hi,

    I might have missed it, but I was looking for a Part II to see the results from your analyses. Maybe you just haven’t had the time, so forgive me my query:
    Have you analyzed different IBIS systems? I am particularly interested in just how much of a sensor movement is required for correcting typical camera shake; ‘typical’ in terms of focal lengths (say, up to 400mm) and exposure times. What are the differences here in terms of single-image vs video (mechanical IBIS only)?
    That question is fueled by the observation that IBIS mechanisms allow for sensor movements can be very large (several millimeters) as seen in various videos that are floating around. Are these large movements actually used for stabilization (camera tilts come to mind)? And if not, why does the mechanism allow for such movements (perhaps for preventing slamming into the stops)? What about potentially increased vignetting with lenses that were originally designed with tight image circles and that are then used with an IBIS body? Surely, a shift of a few pixels won’t matter much, but if it’s a couple of millimeters? Any data on those issues around the extent of sensor movements in typical day-to-day use?
    Any information much appreciated!
    Thanks so much in advance!
    Cheers,
    XV

  • Hmmm 1/70th shutter speed is pretty nice. Looking forward to more info and feedback from app users.

  • Ilya Zakharevich

    I’m sorry to say that what you are discussing here looks like it is completely bogus. There are several independent indications which raise the output of my bogosity detector:

    A) You say “We are about ten times worse at controlling for yaw and pitch” (comparing to linear movement).

    Saying that measurements of incomparable units (different dimensions) differ by 10 times is not a very good indication…

    B) “With the phone sitting just a millimeter or two behind the sensor, we were comfortable we were getting the most accurate results we could…”

    In cameras I saw, the sensor is deep inside the body. There is no way to get the center of mass of the phone to be close to the sensor plane.

    C) Your video shows a very slow movement of your rig (a few Hz, I would say).

    Basically, this means that the data you are going to collect is not relevant to hand-held cameras. How could this happen? I think the reason is the following:

    D) “sampling rate for the app is 100ms”.

    Bingo! Your cut-off frequency is 5Hz, and you do not collect ANY data on what happens on higher frequencies. Let me recall that the first generation of image stabilizers had about 8x dumping of shakes; it was concentrated mostly in frequencies 8Hz?80Hz, and was leading to 1.5?2.5 step improvements. (The dumping-vs-frequency curve for 7D was published; do not have a reference at hand. Hmm, looks like this may be confusing: BTW, it is Minolta, not Canon, if it is not clear from what I wrote ;-].)

    This means that overwhelming majority of contributing shake is at frequencies high above 5Hz. So your measuring+activators loop throws away all the relevant information. Therefere it cannot capture anything relevant to the “real life” performance.

    Sorry!

  • Andre

    Scott, yes, you are correct, and a friend pointed that out to me, too. I’ve since added FL for the native iPhone lens, and while the multiplier is huge, due to the iPhone’s very short FL, it comes out to a very reasonable 1/70ish second shutter speed to get less than 1 pixel shift, so it should be handholdable for many situations, especially in daylight.

  • Mark Turner

    I’m late to the party as usual, but if anyone’s still listening I wanted to thank both TJ Donegan for writing and Roger for hosting such a great article, and all of the commenters’ thought provoking discussion. Regarding Scott and Andre’s math, I think what excites me is that it’s within a rough order of magnitude of the updated rule of thumb even if it isn’t giving a precise match.

    I’m not quite sure why the rotational velocity at 100 is so interesting though; if these were representing the total sum of the data points, I might say that the median is closer to the left-most data point, to the left of 100 anyway, which if you plug something closer to 0.01 rad/sec into your equations will give you something closer to 1/2FL. At that point you might have a 50% chance of having a clear shot (although if you only take 2 shots to hedge your bets, you will only have a 75% chance of capturing a clear shot, statistics being what they are). Maybe a higher chance of capturing a clear shot might be nicer, in which case your 100 data point of 0.03 rad/sec might be a better proxy. But even that doesn’t guarantee 0 blur, you always have a non-zero chance of a large excursion with this statistical distribution, so take a couple of shots if you really have to have the shot. My 18Mpx body gives me a little more leeway, heh.

    Another thing I really like about this, is that even with the previously mentioned questions about the Nexus bandwidth and accuracy for it’s sensor, your scheme subtracts any error out by re-using the Nexus as the calibration tool. That means that even if the data has an offset, it doesn’t matter for the purposes of creating your vibration jig.

    I’m looking forward to the follow-on article. Thanks again!

  • Scott McMorrow

    Andre

    While sitting in the sun pondering, I realized that the mistake you made was with the FL rule of thumb calculation. It should be calculated with respect to the 35 mm equivalent focal length. This will give you reasonable numbers to compare with full frame cameras.

  • Scott McMorrow

    Andre,

    I found an Imatest measurement of the iPhone 4S, which has the same image size as the iPhone 5. Resolution was about 590 lp/ph. That’s equivalent to 2.7 pixels. Based on that, the minimum shutter speed would be around 1/30th to obtain the full resolution possible from the camera. Looks like a pretty solid design to me.

    Scott

  • stigy

    Great work !! would be really keen to know which method of stabilisation ( Lens vs In Body ) works out better.

  • I’d love to see some distinct shake info for macro (or at least macroish) distances. Canon claims their new HIS on the 100mm f2.8L does a better job at macro distances then regular IS, but I’ve yet to see numbers…

  • Andre

    Scott, I’ve updated the spreadsheet because a friend found a bug in cells D14-22 where I used a rounding function I shouldn’t have been, and I made it easier to compute the numbers for different size sensors (just input the horizontal size as well as the horizontal pixel count).

    So now I’m of two minds about this computation. On the one hand, something doesn’t smell right or it’s super conservative. Inputing numbers for the Sony NEX-5N, Canon EOS 40D, and iPhone 4 (2592 horizontal pixels, 4.54 mm horizontal size) yields respectively 6x, 5x, and an incredible 17x for the iPhone 4. So either the iPhone 4 will improve tremendously if shot on a tripod and tripped remotely or something else is going on …

    On the other hand, thinking about the physics of it, this number seems like a best case. For example, we make an assumption that only a shift of 1 pixel will affect sharpness. However, if the projected feature on the image plane shifts, say, half a pixel, but is enough to change the value of its neighboring pixel, then that could affect sharpness as well. Also, I would think that the shakiness is actually a vector sum (since we need to include the direction of the shake) of everything on the PD chart above weighted by their frequency, and so could be much worse than .003 rads/sec.

    But then I just saw a comment from one of my favorite photo bloggers, Ming Thein, who’s testing an Arca-Swiss Cube C1 that he’s seen differences on his D800E between the Cube and his own Manfrotto 410, so maybe we are underestimating the amount of image quality lost due to camera shake …

    So I’m not sure anymore of the conclusions. It certainly needs more thought.

  • Scott McMorrow

    Andre

    That’s fantastic. I made the computations with a spreadsheet, and it’s good to get confirmation that I didn’t mess it up! Next step for me is to perform some testing with Imatest. I actually own Imatest with a 72″ test chart and have a Sigma 35mm f/1.4 Art lens coming. Now I need the time away from my consulting business to perform some test experiments.

    Once I started looking at the information that the spreadsheet produces, it became clear to me why hand held photos are such a hit or miss proposition for me some times. The curve that was originally presented by TJ is essentially a probability density plot of the rotational rate. I picked the 100 count bin, because it appears to be close to the mean of the curve. Sometimes we press the shutter button and were’re to the left of the mean where the camera rotates more, sometimes we press the button and it rotates less.

  • Andre

    So inspired by this great article and Scott M’s really interesting comments, I whipped up this spreadsheet to compute the numbers that Scott came up with. It’s for the horizontal dimension of the D800 sensor. At cell F13, I compute focal length multiplier rule-of-thumb, and it looks like you need 6x-7x focal length shutter speed in order to maintain per-pixel sharpness when handheld for the count=100 datapoint in the chart above.

    I’ve set it to read-only, but you can comment, and you should be able to download it in various formats to play with it:

    https://docs.google.com/spreadsheet/ccc?key=0AgwjmWLBupUndDRFUmtRQjV3SGsxWHJvRjFLVWJTTmc&usp=sharing

    Enjoy!

  • Scott McMorrow

    Samuel,

    Yes, using a resolution metric like line pairs per image height is absolutely useful. That does,however, eventually relate to the pixels in the sensor. A D800 with an ideal lens is capable of resolving 2456 lp/ph. The Zeiss APO-Sonnar 135mm f/2 lens on the D800 is currently topping out at 1940 lp/ph resolution. That’s about 80% of the maximum resolution of the sensor.

    Camera shake that causes blur from one pixel to an adjacent pixel would essentially blur those two pixels together, halving the imaging resolution. In that case, the sensor quickly dominates, and potential resolution is reduced to around 1250 lp/ph. A sqrt(2)pixel shake reduces resolution to 880 lp/ph. A 2 pixel shake reduces resolution to 625 lp/ph. Tell me the final resolution you desire, and I’ll tell you how much shake can be tolerated. Throw this sort of shake on a lense with 550 lp/ph resolution, and you end up with a final image resolution of around 400 lp/ph.

    Scott

Follow on Feedly