Geek Articles
A Geek of Many Colors – Adventures in Spectrometry
Please Note: This is a Geek Level 3 Article. It has no useful information about photography or videography. If you’re a lens geek, though, it’s kind of cool. And it will serve as our background and methods for upcoming articles.
Well . . . How did I get here? David Byrne
One of the nice things that happens at Olaf Optical a lot is we wander off on tangents. Way back when, we found ourselves (much to my dismay) testing filters. When we started testing filters, Brandon began to Speaking in Tongues (his tongues being physics and math) about how we could set up a spectroscopy lab for just a few thousand dollars. So we did that, and it was pretty cool.
But then we thought, hey, it would be even cooler to measure the spectra of various lenses, too. We knew measuring the transmission spectra of a lens, with multiple elements bending light, was a lot more difficult than measuring transmission spectra through a flat plate of glass. But it was Winter, which is slow around here, and we were bored, so we thought we’d give it a try. (The alternative theory is that we were happy and content, and uncomfortable feeling that way, so we decided to do something nearly impossible.)
Brandon, speaking in more tongues, thought we could add a couple of widgets to our flat plate spectrometer and would be able to test lenses. Brandon was wrong less correct than we had hoped. By the time he had figured that out, well, we were going to do this no matter how many innocent people died in the process and how much of other people’s money we spent. Months later, having replaced light sources, collimators, integrating spheres, and hardware, we began to get results.
How Do I Work This?
The (somewhat) standard way of measuring lens spectra is with a Monochromator. This sends a specific wavelength of light through the lens and measures the transmission; then you change the wavelength and measure it again about 2.2 bazillion times. This gives you absolute transmission at various frequencies and is the gold standard.
But monochromator spectrometers are either breathtakingly expensive, very slow, or both. We test hundreds of lenses a day; very slow is useless to us. A transmission spectrogram is very fast; a few seconds per lens after calibration, but gives relative, not absolute, results. In other words, it doesn’t say ‘this lens passed 97% of the light at 540nm wavelength. It says ‘this lens passes the most light at a 654nm wavelength, and at 540nm it passes 94% as much light as it does at 654nm’. That works fine for our purposes; there are other ways we can measure absolute transmission.
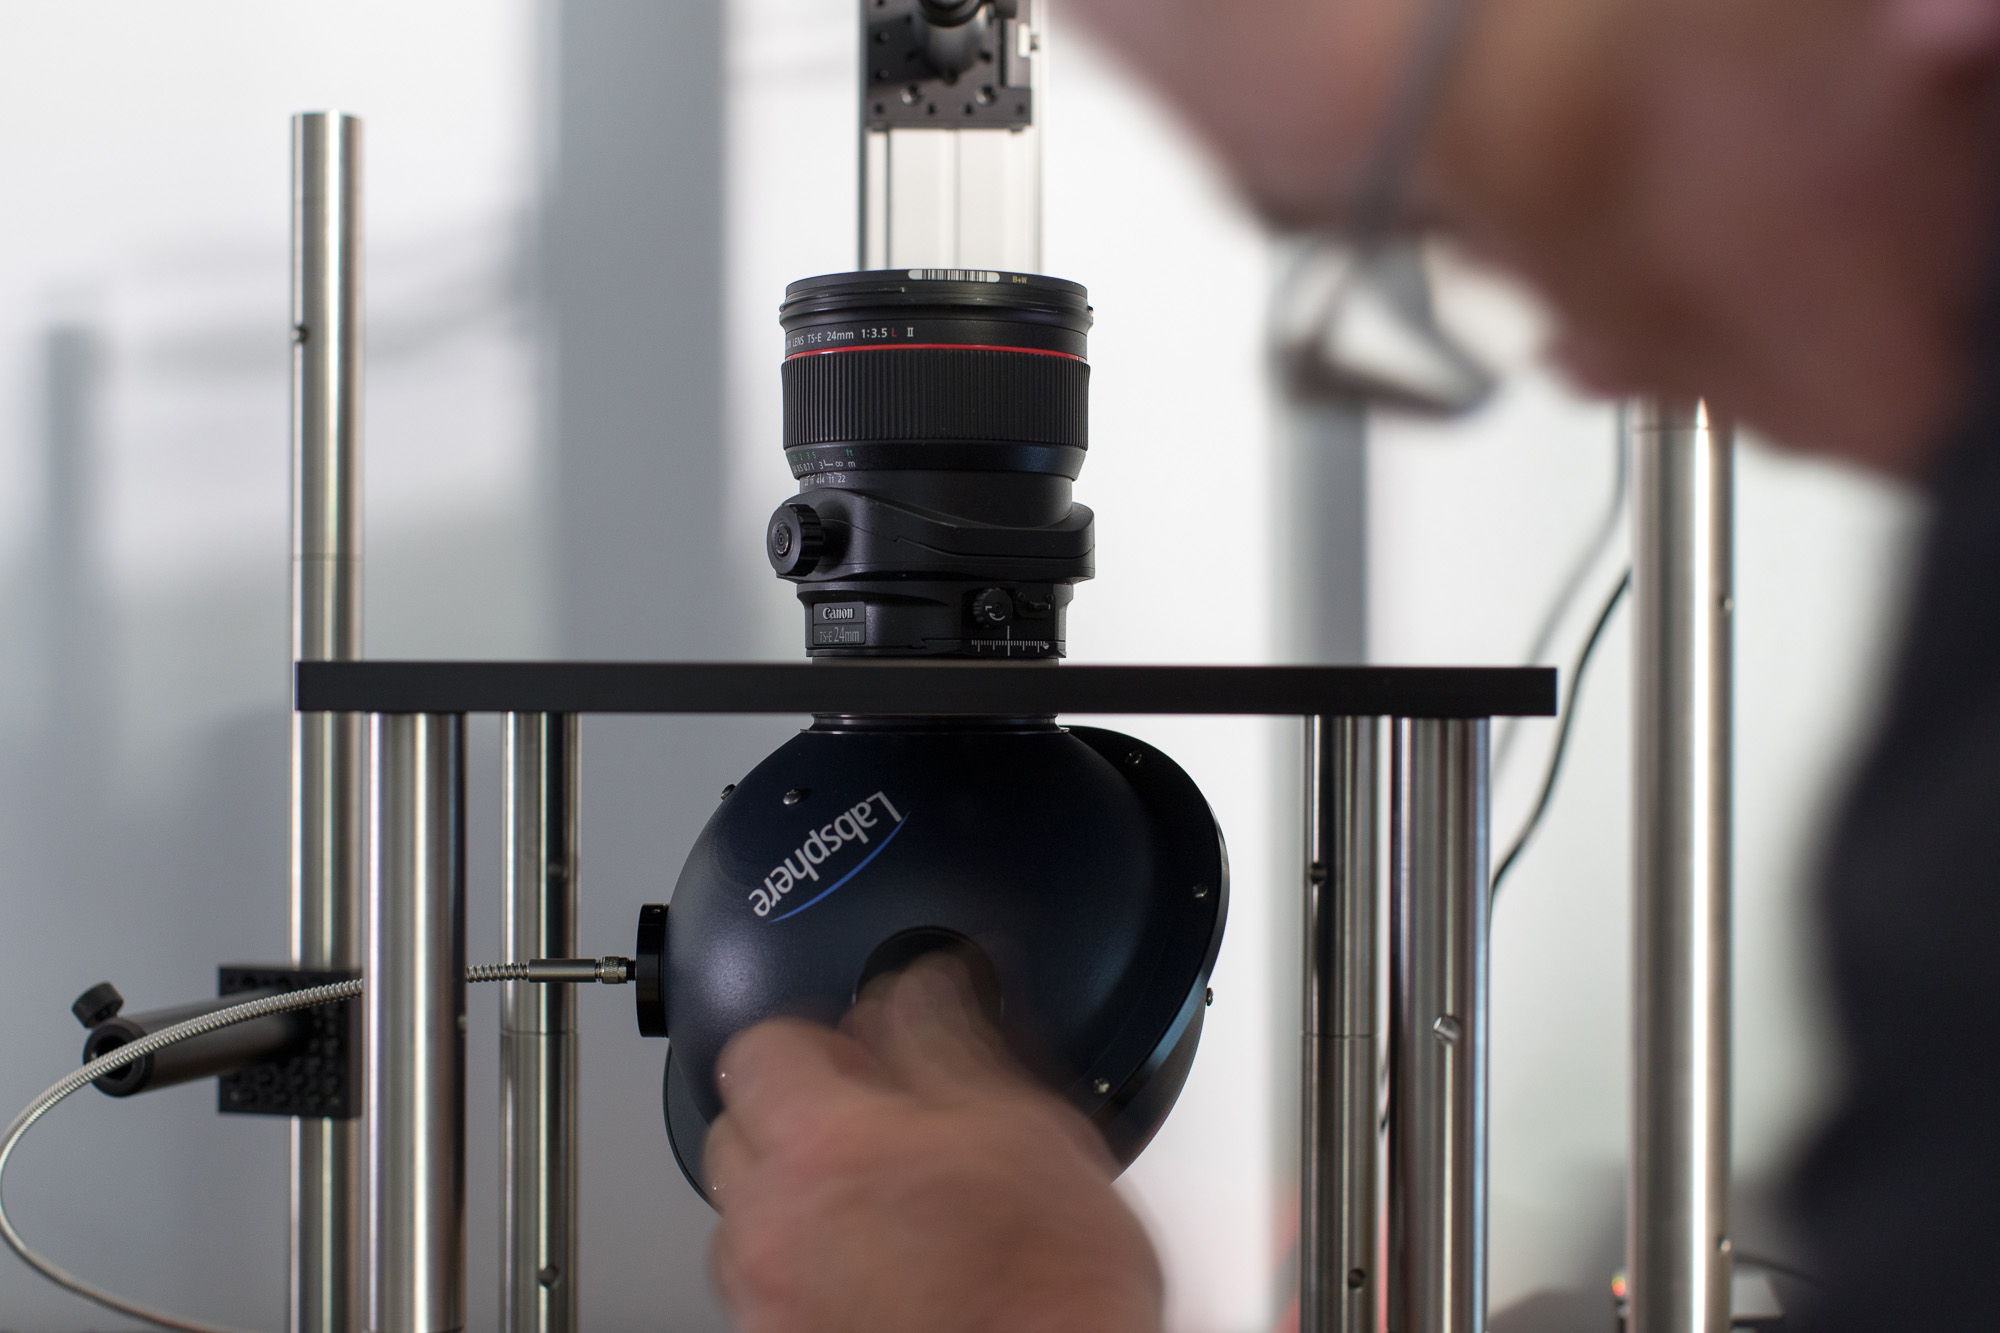
Our method is, in theory, very simple. A strong light source passes through spectral flattening and diffusing filters, is collimated, and then shines into an integrating sphere attached to a spectrometer.
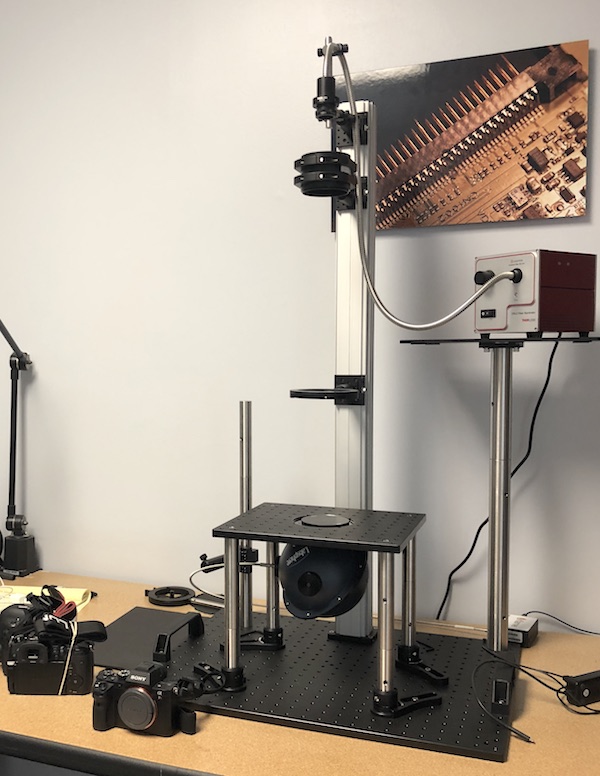
Doesn’t look like it costs as much as a nice used car, does it?
After the aperture of the beam is adjusted to the proper size for the lens being tested, the system is light and dark calibrated, a lens placed in the beam and the transmission spectrum mapped out like the graph below.
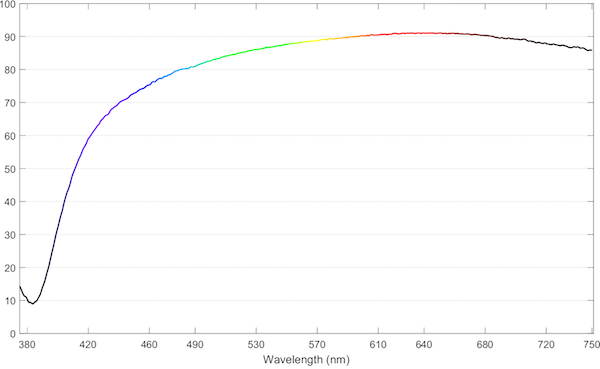
Lensrentals.com, 2018
The lens above would have a rather warm cast since it transmits red light much better than green or blue. (You’re welcome for the nice graphing program showing you what color is where, courtesy of Markus Rothacker. Notice that the graph turns black outside of the visible range, both UV, and IR.)
Is our method perfect? No, not at all. We have to change integrating spheres to different sizes when we get down to smaller aperture lenses. At very small apertures we’re screening out so much light that we have to increase the gain on the spectrometer to the point where noise becomes an issue, especially in the red spectrum. Eventually, the aperture can get so small (a 15mm f/3.5 for example) that we just can’t get enough light through the system to test effectively, at least not unless we get a nuclear fusion light source or something.
And as I mentioned above, this doesn’t give absolute transmission numbers; they are relative. We can compare various 35mm f/1.4 lenses and say with accuracy this one lets a little more light through than that one. But we can’t directly compare a 35mm f/1.4 with an 85mm f/1.4; the apertures are different sizes, so the amount of light entering the integrating sphere is different.
But is it fast? Oh, hell yes. Once it is set up for a given lens (85mm T1.5, for example), we can run spectra about as fast as we can change lenses. At small apertures, when we have less light, it may take 10 or 15 seconds per lens, which is still fast.
Am I Right? Am I Wrong?
So we had a technique that makes pretty graphs that look cool, but we still didn’t know if it is was test-worthy. To start evaluating that we’d take a single lens, test it, undo the testing set up, set it back up, retest it, etc. If the technique was reproducible, we should get the same results every time, and we did.
Then we checked multiple copies of reputable lenses to see if they were the same. Again, that worked well.
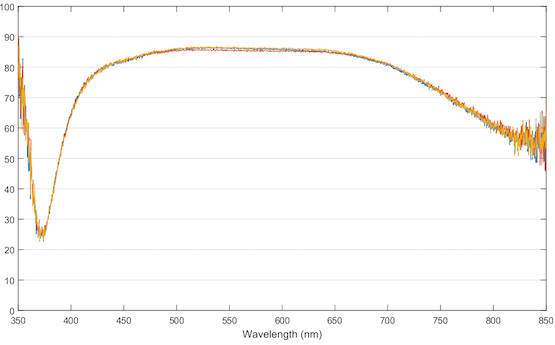
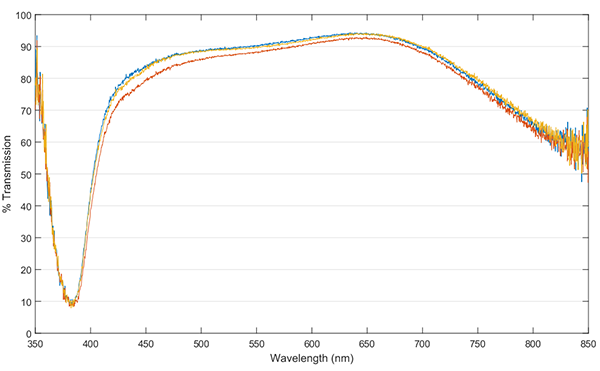
Spectrograms of 4 copies of a lens.
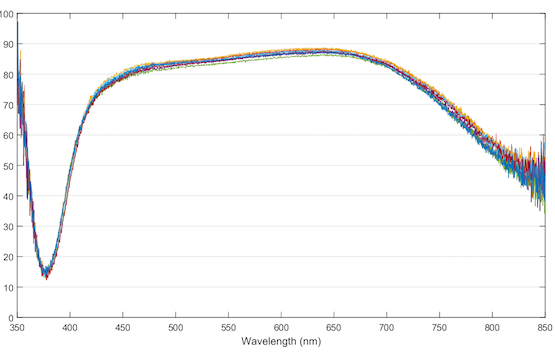
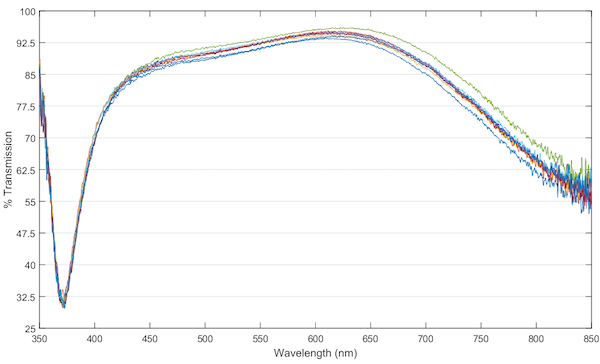
Spectrograms of 9 copies of a different lens
The results were reproducible and consistent, but we had to see if they were also accurate. Sigma Photo was kind enough to share their in-house spectrometry data, allowing us to compare our results with theirs. We also had our laser transmission set-up which does absolute transmission measurements, although only at four discrete wavelengths. So, we compared our spectrograms to Sigma’s spectrograms and our laser transmission data.
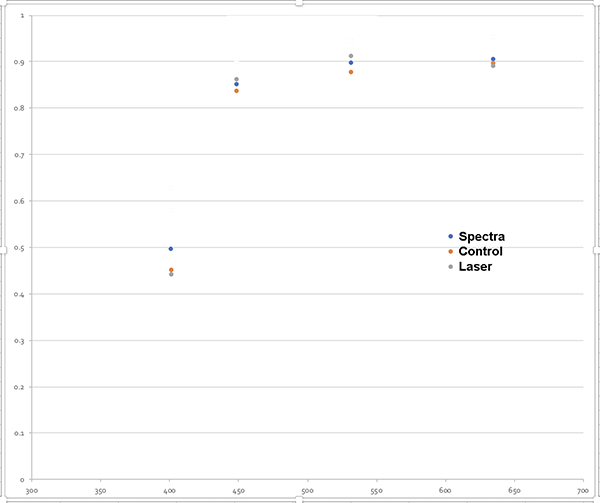
This let us know where we matched up well and where we seemed to have issues. To make a long story short, we found at extreme apertures our system gave slightly different results at first, which is what led to different sizes integrating spheres, changes in light sources and filters, etc. When the dust settled (and I’m talking several months of settling), we were able to accurately test spectra in lenses with aperture diameters of just under 1 cm (a 24mm f/2.8, for example) to about 7 cm (85mm f/1.2 or 135mm f/1.8) with good accuracy and reproducibility.
Into the Blue Again, After the Money’s Gone
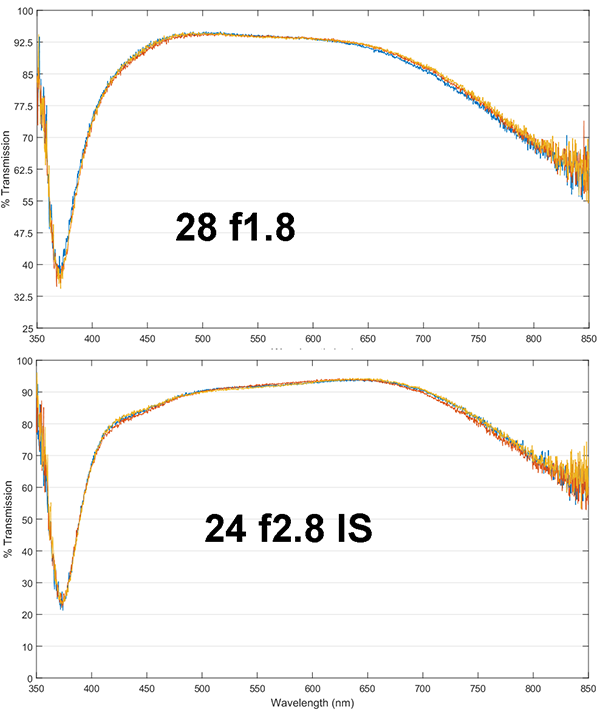
Finally, having spent all our money and done lots of calibrating, we came to the ‘but can you see it’ phase of testing. If our spectra were really showing a significant difference, then we should be able to predict results that could be seen by imaging. For example, below are the spectra for multiple copies of the Canon 24mm f/2.8 IS lens and the Canon 28mm f/1.8 lens. The 28mm is a much older design and has a cooler tint (transmission is greatest at the blue end of the spectrum) than the 24mm f/2.8 lens, which has the highest transmission at the red end of the spectrum.
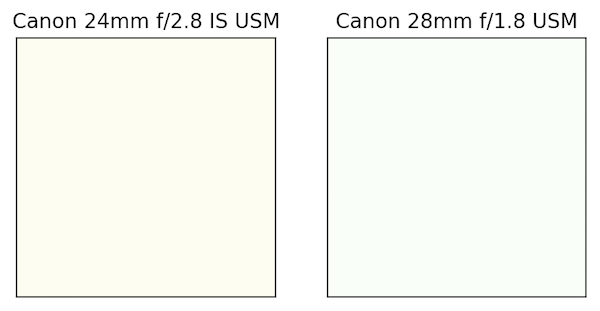
If we turned off a camera’s white balance and took pictures of a whiteboard we should see a slight difference in the tint of the images, and that’s precisely what happens. (Well, we’re assuming some reasonable monitor calibration, too, but you should be able to tell the 24mm has a slightly orange tint, while the 28mm is rather blue-green.)
Of course, if you white balance before you shoot, they’d be identical. Probably. And for those of you thinking ‘well, you could have just taken the pictures to start with,’ where’s the fun in that?
The second confirmation we got was somewhat accidental, but let us test our main reason for doing this — to be able to rapidly check if a lens’ coatings were altered in some way. We were asked to optically test a lens that seemed to have slightly low contrast. Our regular tests showed it was just a little less sharp than it should be, but there was no sign of any decentering or optical issues. It was puzzling.
When we did spectrometry comparing it to other copies of the same lens, it was apparent that this lens (red graph below) had slightly lower transmission, particularly in the yellow to blue wavelengths.
Olaf Optical Testing, 2018
Further investigation showed that the second element had a different reflective color; it was inadequately or incorrectly coated. (It was nearly new, so it seems unlikely that the coating had deteriorated.) While most of you probably think that’s a stupid thing to test for, the photographer who owned this lens didn’t.
And remember, we handle thousands of lenses. Sometimes coatings wear down on front elements (or scammy resellers remove the coating when buffing off scratches – yes it happens; usually on very expensive lenses). Exposure to certain fumes can ruin coatings, too. Resin or glue between elements can deteriorate and fog over time. This gives us a way to detect these problems quickly, accurately, and efficiently.
Where Does This Highway Go To?
Detecting lenses with coating damage is the main reason we’re doing this, but there are some fun things that we can do, too. We can compare different lenses and look at their color cast. Everyone knows some have slightly warmer looks, while others are cooler. Many people claim a certain brand has this look or that. Yet for the Canon lenses above, a certain brand of lens doesn’t imply a particular color cast; those two were quite different. We’ll put out some articles soon showing spectra for multiple lenses from each brand.
There are other esoteric questions we want to answer. For most lenses we’ve tested, there is almost no copy-to-copy variation in lens spectra. There are a few lenses, however, where things do seem a little more variable. Usually, that’s just a minor difference in transmission, like the one below. But we have found a few where coatings in different copies have a different spectral curve, not just a bit more or less transmission.
Olaf Optical Testing, 2018
Cinema lenses are generally color matched, but there’s some variation there too. And when a company makes both Cine and photo version of a lens, are the spectra the same, or different? (The answer is yes, BTW, depending on the company.)
In the next couple of articles, we’ll show you a lot more spectra and a few interesting and sort of surprising things we’ve found. It probably won’t change how you create images at all. But, for some of you, it will be fun to see.
Roger Cicala, Brandon Dube, and Aaron Closz
Lensrentals.com
April, 2018
The authors wish to express their thanks to Sigma-Photo Corporation, especially Kazuto Yamaki and Jumpei Nakamoto, for their invaluable input, which speeded our calibration process by many weeks.
Author: Roger Cicala
I’m Roger and I am the founder of Lensrentals.com. Hailed as one of the optic nerds here, I enjoy shooting collimated light through 30X microscope objectives in my spare time. When I do take real pictures I like using something different: a Medium format, or Pentax K1, or a Sony RX1R.
-
CheshireCat
-
Munchma Quchi
-
Roger Cicala
-
Hank Roest
-
Dr Klaus Schmitt
-
Roger Cicala
-
Brandon Dube
-
Dr Klaus Schmitt
-
Brandon Dube
-
Dr Klaus Schmitt
-
Roger Cicala
-
Dr Klaus Schmitt
-
Brandon Dube
-
Dr Klaus Schmitt
-
Brandon Dube
-
Emmett
-
Athanasius Kirchner
-
Athanasius Kirchner
-
Søren Stærke
-
Claudia Muster
-
Ilya Zakharevich
-
Roger Cicala
-
geekyrocketguy
-
Greg Dunn
-
John Dowdy
-
John Dowdy
-
Roger Cicala
-
Søren Stærke
-
Nikolai Vassiliev
-
Brandon Dube
