The Three Questions
I get asked a couple of questions every time I publish a graph showing Imatest results for multiple copies of lenses like the one below. Most people understand that some copy-to-copy variation is inevitable in the manufacturing process. Most are surprised, though, at how large the sample variation seems to be. Heck, I was surprised at how large the sample variation was when I started doing this kind of testing.
The three questions I get asked over and over are the same questions I asked myself when I first started seeing these results:
- Are you sure the variation is that great?
- Can you really see the difference in a photograph?
- Can optical adjustment make the copies with the worst results better?
Rather than constantly answering these questions in email, I thought I’d just make a reference post that answers them as completely as I can.
1: Sample Variation is Real
Most of us are aware that there has to be some variation between lenses, since we all know every manufacturing process has variability. But it was comforting to think that lenses were all the same because it would make life simpler. Reading lens reviews, for example, is a lot simpler if we can just go to our favorite site, rather than try to average out the results of half-a-dozen reviews to get a mental picture of what the lens is like.
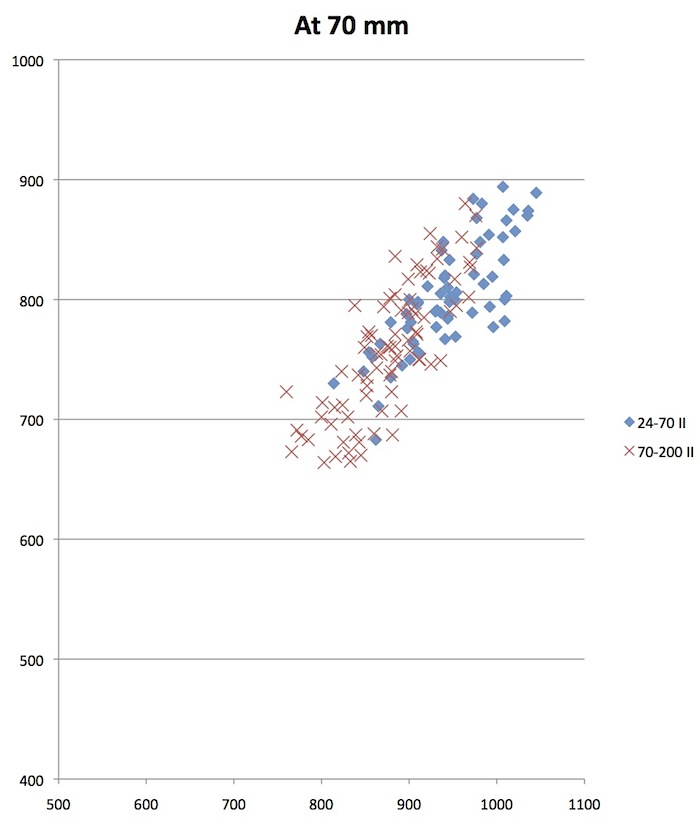
The graph below provides a good example. It shows the Imatest MTF50 results for Canon 24-70 f/2.8 Mk II lenses and 70-200 f/2.8 Mk II IS lenses at 70mm. If you go online to any forum you can find multiple-page debates about which is sharper. If you average each lens together, the 24-70 would win by a hair. But it wouldn’t be a significant win, really. If you pick one copy of each lens at random, chances are about 60% that you’d find the 24-70 f/2.8 a bit sharper with meticulous, pixel-peeping numerical tests. So it’s not shocking that a number of the people who talk about the two lenses say their 70-200 f/2.8 IS II was at least equal to, if not sharper than the 24-70 Mk II. Those reviewers aren’t incompetent. It’s just the statistical laws of sampling at work.
I have a scientific background, so my first thought when seeing more variation than expected was our testing methods weren’t accurate. So we refined testing methods, eliminated bad copies, and tested only new copies. The variation was still there.
It didn’t matter what brand, there was similar sample variation. It was a bit greater in wide-angle lenses and zooms, less in prime lenses and telephotos. But whenever we tested a significant number of copies, we saw similar variation.
Like most people testing lenses, we used Imatest. But maybe a lens-test projector would be better. Nope. Well, the gold standard was MTF measured on an optical bench. So we (despite the vigorous protestations of those-who-manage-the-money) bought an optical bench. It showed a similar amount of copy-to-copy variation. (The optical bench might make it sound better, though. It’s amazing the number of people who think the difference between 0.65 and 0.70 on a zero to one scale is ‘about the same’, while they think the difference between 650 and 700 on a one to one thousand scale is hugely different.)
2. Can You Really See the Difference?
This is where things get gray, rather than black and white. The answer is it depends on two things.
The first part is which copies you looked at. Obviously the difference between the very best and very worst copies in each group are going to be more significant than one of the ‘pretty good’ and ‘pretty bad’ copies. Chances are if you just picked any two of the lenses from the graph above you would be hard pressed to find the difference.
The second thing is obviously how closely you look. If we take the best and worst 70-200 lenses above and make online jpgs to show our friends, chances are very high we could see no difference even between the best and worst copies. Even a small print probably would not show a difference. In a large print (say 20 X 30 inches) or at 100% pixel peeping we could see the difference between the best and the worst copies. We might even be able to differentiate between one of the top 20% copies and one of the worst 20% copies if we compared two shots side-by-side.
For the vast majority of copies, though, we couldn’t really tell in a photograph. The numbers seem quite different, but the photographs don’t. (For more detail, you can read this article.)
3: Lenses Can Be Optically Adjusted
When you test several-thousand heavily used lenses, you find a lot of optically bad lenses (NOTE: A bad lens is outside the range described by sample variation. It’s much worse. On the graph above a bad copy would be way down in the lower left corner or even off the chart.) Over time we learned that there were adjustable elements in most lenses that could be used to correct optical problems in many of these bad copies.
We learned how to do a lot of those adjustments ourselves. Partly because that’s how we’re wired; we just have to know. Partly because fixing things in-house lets us get it back in stock in days, while sending it off for service may take weeks. And partly because we learned that while the service centers are absolute wizards at fixing a burnt-out autofocus motor or adjusting electronic focus, they aren’t always that great at optically adjusting lenses.
Eventually, we got to the point where with some lenses we could do a better job than the factory. Don’t get me wrong; it wasn’t because we knew more. It was because we were willing to spend hours meticulously adjusting-measuring-adjusting-measuring a single lens. In at least some cases, it was because we had better measuring and testing equipment than the service center did.
I guarantee you the factory is a lot faster than we are. But I also know any service center’s goal is to get the repair done as quickly as possible. Time is money. So spending the time we were willing to spend gave us a big advantage.
But There Are Limits
Anyway, we could take an optically bad lens (most of them, anyway) and get it right back up to the pack with the others of its kind.
But what we aren’t able to do is to take the lowest 10 or 20 lenses in a test sample like the one above and make them better; at least not consistently. In other words, we can usually make a really bad lens adequate, but we can’t usually make a slightly below average lens better. We’ve spent a lot of time trying to figure out why that is.
The Causes of Optical Imperfection
We know when a lens designer finishes designing the lens; he or she has mathematically calculated what the optics will be like (and the manufacturer, with one or two exceptions, prints out the MTF charts from those mathematical calculations). The calculations assume each element is in absolutely correct position.
One of the other steps in lens design is ‘tolerancing’; that is, determining how much the inevitable small variations between the theoretical design and the actual manufactured product will affect the lens. It may be found that a tiny variation in one element would cause a huge change in the optical characteristics of the lens. At this stage the designer, knowing such manufacturing precision is impossible, might trade off losing a bit of resolution or a slightly increased aberration for a more realistic tolerance that could actually be manufactured.
Later in the design process ‘cost tolerancing’ comes into play. While we don’t know the exact tolerances and acceptable costs for the various manufacturers, we do know that a more precise the tolerance results in a big increase in cost. Jenoptik (manufacturer of precise laboratory grade lenses), for example, states their high quality lenses cost 2 to 4 times as much as a standard manufacturer’s lens. Their highest quality (and they make stuff for satellites and the military) costs 10 to 100 times as much as a standard quality lens.
For those of you who like to avoid reality, let me be very clear. There is no such thing as zero tolerance. Not if you measure accurately enough. If you want the very best quality obtainable, then a nice f/2.8 zoom would be priced at $20,000 to $40,000. What a coincidence — that’s about the price range of cinema-quality zooms.
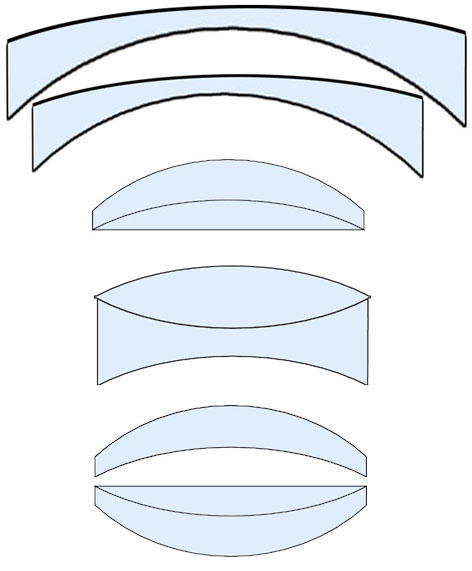
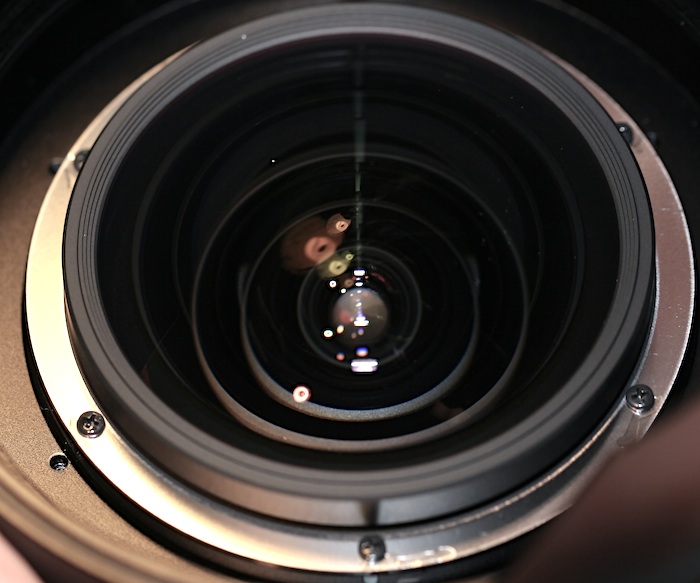
The bottom line is when each copy of the lens is actually assembled there are tiny variations in the placement of each element, the curvature of each element, even in the refractive index of each element. The diagram below shows the common variations in element placement that occur when a lens is actually manufactured (greatly exaggerated).
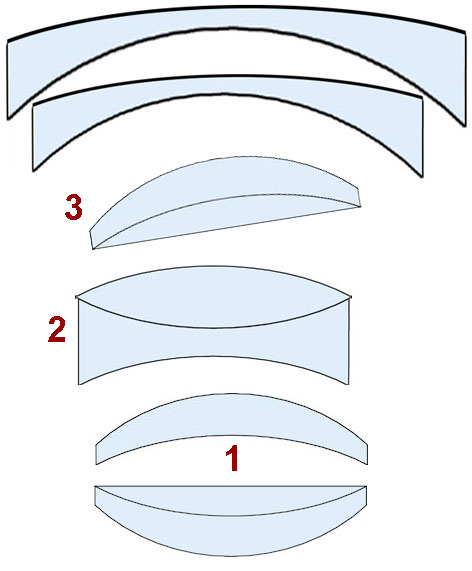
Every single element in the lens will have some manufacturing variation. For example, let’s just consider the rearmost group, a cemented doublet. Here are the tiny errors that will (to some small degree) occur in every copy:
- The refractive index of the glass used varies a bit in every batch of glass, for each of the two elements.
- The curvature of the elements when they are made and polished may be a tiny bit different (on each of the two surfaces for each element).
- The gap where they are cemented together may be a bit thicker or thinner than the theoretical design.
- The elements may be cemented together a bit off-center.
- When mounted in the lens, the cemented group may be slightly off center, slightly tilted, or have a slightly incorrect space between it and the element in front of it.
That’s just the rear cemented doublet. We have to repeat those errors for each element and group when we consider the entire lens.
The Mathematical Difference Between ‘Bad Lens’ and Variation
Earlier I mentioned that if we test a large group of lenses we see there’s a fair amount of variation in the good copies, but the bad copies are much different. Here’s a good example of the difference as seen on Imatest:
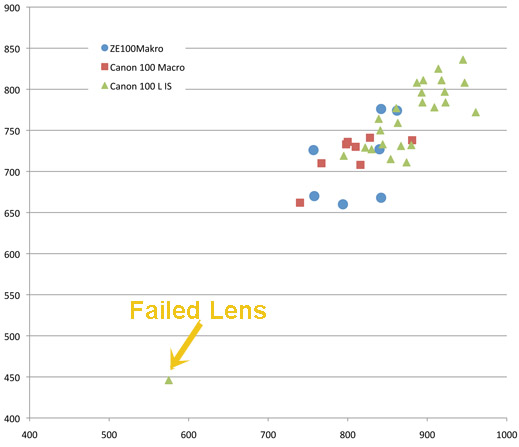
Most of the lenses are in a fairly tight group, the really bad lens optically is quite apparent. It’s nice when we can show mathematically why that would be the case.
The total error of the lens (the effect of all of those tiny manufacturing errors discussed above) is expressed as the “root sum square” (RSS). The math is pretty simple; you square all of the errors of a given type, add the squares together, and then take the square root of the total. That’s how far off the entire lens is from theoretical perfection.
For example, if we have a 9-element lens, and every element is off center by 2 microns, then the root sum square for the entire lens would be ?(9 x 22), which equals 6. If we reduce the error of each element to 1.5 microns, the RSS would be reduced to 4.5. If we increased the error of each element to 2.5 it would increase the RSS to 7.5.
But if we get one element way out of position, lets say 7 microns, while all the others remain at 2 microns, the RSS jumps to 9. That’s exactly the same RSS we would get if every single element were 3 microns off-center.
If we assume the quality assurance at the factory could detect / correct centering variations of 2.5 microns or less, than the worst total RSS the lens could have would be 7.5 from the tiny manufacturing variations inevitable in each element. That’s the worst case scenario, an actual copy of the lens would probably be a lot less than that.
But just one element with a large centering variation that got through quality control would make a bad copy, one with an RSS much larger than 7.5.
Of course, this is a massive simplification. (I’m making these numbers up as an example – there’s no way a manufacturer could be this accurate at a reasonable cost.) In reality there is more going on at each element than just centering. If an element was really misplaced it would have a large effect on centering, tilt, and perhaps even spacing. Plus, certain elements in the lens are critical elements and a variation in those may have a greater effect than one involving another element.
But the basic theory is the same: a lot of small imperfections in the various elements add up to cause a small imperfection in the lens. One element with a large imperfection can cause a large imperfection in the lens.
It seems reasonable to assume that quality control and manufacturing precision can usually prevent the large problems causing a ‘bad lens’. It is impossible, at anything like a reasonable cost, to prevent the multiple small imperfections that create copy-to-copy variation.
Optical Adjustment
We know that most lenses have 2 or 3 elements that can be adjusted after assembly. For example, an element may be shimmed or placed on an adjusting ramp so that the spacing between it and other elements can be changed.
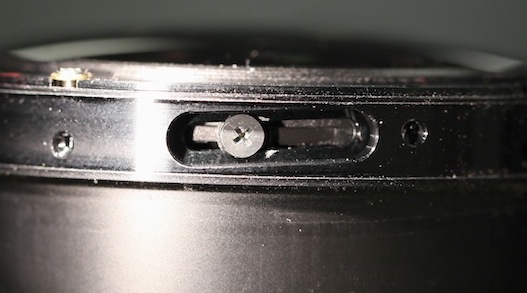
Another element may be held in place by eccentric (oval shaped) collars. Rotating the collars changes tilt and / or spacing of the element.

Or, an element may also be placed on a plate so it can be slid from side to side to center properly.
So this should let us fix those minor problems that are inevitable during assembly, right? Not so fast.
Lenses have just a few adjustable elements; most elements can’t be adjusted at all. Some lenses have no adjustable elements; the various elements are fixed permanently as the lens is assembled so what you get is what you get.
Additionally, an adjustable element might be only tiltable, only centerable, or movable for spacing. Occasionally one element may have more than one correction. (The Canon 24-70 f/2.8 MK I front element, for example can be centered, tilted, and moved up or down.)
If we perfectly position those adjustable elements for centering, tilt, and spacing, will we end up with a better lens? Perhaps if we could position them with near-perfect accuracy we could reduce the amount of sample variation. There are certain pieces of testing equipment that can evaluate centering, tilt, and even spacing of the various elements within a lens. They’re expensive, but if they could simplify and improve the process of optically adjusting a lens, they might be worthwhile.
So over the last couple of months, we’ve investigated how much improvement we could make in various lenses using the best equipment we could find to perfectly center those elements that were adjustable.
The Results
I won’t bore you with all the details of playing with various 6-figure pieces of optical testing equipment, other than to tell you with such equipment we were able to take some sample lenses and put the adjustable elements in mathematically near-perfect alignment. Guess what happened?
Below is an imatest printout of a good lens. It has a bit of astigmatism, but overall slightly above average Imatest results compared to other copies.
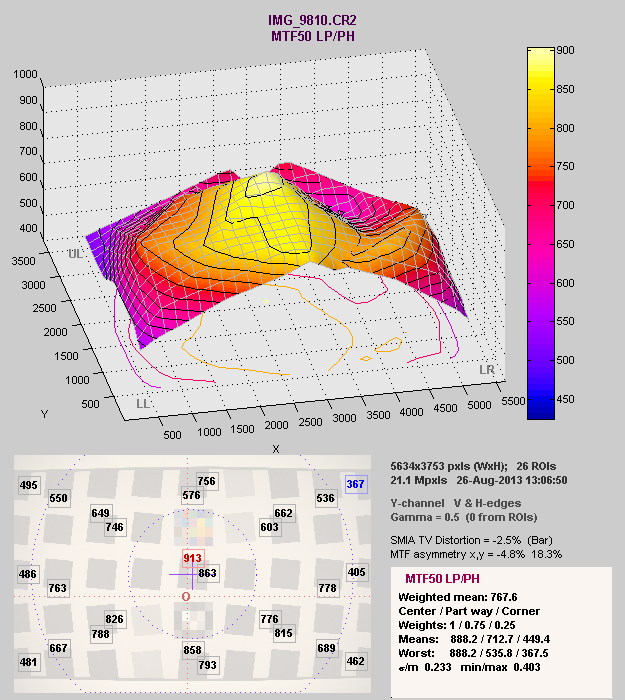
After using some amazing machinery to perfectly center the adjustable elements, we ended up with this:
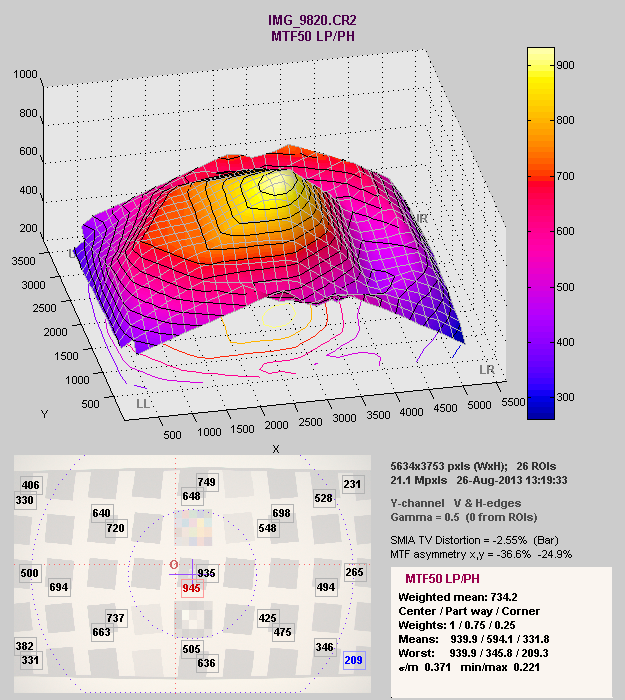
After adjustment the center point has higher resolution and lower astigmatism. But resolution in the right side has been markedly reduced and astigmatism increased.
This is one example, but we’ve dozens of others. Sometimes, like this one, we would get a lens with an extremely sharp center but at the price of much weaker corners. Or we might improve resolution, but at the cost of increased astigmatism. Getting maximum resolution at the long end of a zoom may soften the short end a bit. Getting the corners as even as possible may give up some center resolution.
I should have realized this was the case when I found that most manufacturers identify what I’ve been calling ‘adjustable elements’ as ‘compensating elements’. Adjustment is not supposed to exactly center and align this element; rather it must be slightly out of position to compensate for the inevitable manufacturing tolerances of the other elements. It’s adjusted to give a ‘best overall result’ by compensating for the tiny errors in the rest of the lens.
This means that each lens, adjusted as well as possible, still isn’t perfect. And it will be slightly different from others of it’s kind. Measured carefully enough, one copy might have a bit softer corner, another is a bit softer at one end of the zoom range, this one might have a bit more astigmatism, while that one has a bit higher center resolution.
Does it make a difference when you’re taking pictures? Rarely, but it can happen. Remember, a badly out of position element causes a huge difference in the lens’ optics. The many small variations cause only minor differences. They probably will only be apparent with careful measurement using testing equipment, or severe pixel peeping.
The Good News
The laws of physics, manufacturing tolerances, and simple economics mean sample variation can never be entirely eliminated. Scream all you want about how you expect a perfect lens, but unless you’re willing to pony up $20,000 to $40,000 per zoom, you aren’t even going to get into the neighborhood of near-perfection.
There is good news, though, and it makes a lot of sense. In earlier posts I’d shown that for most lenses, the sample variation is generally right about at the limits of what we could detect visually in a photograph. That makes perfect sense. Lens designers are pretty smart guys and manufacturers are going to keep a pretty tight grip on costs. The logical place to keep sample variation would be where you can hardly see it.
Historically, that was more than fine. In film days, not many people would take 1,000 test target shots and print the images to maximum size to see if they had a great copy. Of course, digital changed all of that.
Crunching numbers, especially the big numbers that we get when testing lenses, makes the variation seem huge. The difference between 800 and 900 line pairs per image height must be noticeable, right? That’s a huge difference. But the truth is it’s not usually visible in a photograph, even a large print photograph.
Sure, if we pixel peep and analyze we can find that this copy has a better number in the center than that copy. But if we look closer, that copy might be better in the corners, or may have less astigmatism. Or that copy may have better acutance or less flare. In general the difference in copies that looks so impressive when charted numerically in a graph, or when this reviewer says 800 line pairs and the other reviewer says 750, is insignificant.
Not to mention there’s a lot more to it than just the resolution numbers we spout off in our lens reviews. Few reviewers give astigmatism numbers, or do careful flare testing, or measure actual light transmission. And all the numbers in the world can’t tell you what a picture taken with the lens looks like.
As to improving sample variation, I’m not ready to give up on that quest yet. There are a number of tools and techniques we’re exploring. But the laws of physics and economics mean it can’t be eliminated entirely.
References:
Geary, J: Introduction to Optical Testing. SPIE Press, 1993.
Ishikkie, M, et al: Lens Design: Global Optimization of Both Performance and Tolerance Sensitivity. SPIE International Optical Design Conference, 2006.
Malarca, D: Optical Shop Testing. Wiley and Sons, 2007.
Schwertz, K and Burge, J: Field Guide to Optomechanical Design and Analysis. SPIE Press, 2012.
Schwertz, K: Useful Estimations and Rules of Thumb for Optomechanics. University of Georgia, 2010
Smith, Warren J. Modern Optical Engineering: the Design of Optical Systems. McGraw Hill, 2000.
Youngworth, R: The Continual Evolution of Tolerance Assignment in Optics. SPIE, 2009.
Roger Cicala
Lensrentals.com
September, 2013

74 Comments
Tom Alicoate ·
I would love to see you start selling lenses that are rated +1 +2 etc based on thorough analysis of them. my 70-200 f4L is sharp, but inconsistent. I would love to have it checked with my 5D. Seems like it could be a new branch. High end calibration for pixel peepers. You could put a blue ring on the lens. Thanks for the article. Great stuff!
ginsbu ·
This will surely silence the forums! 😉
Mike ·
Many thanks Roger for a very informative article.
Peter ·
Thanks for this beautiful article.
I find it extremely well written, fun to read and easy to understand. I have myself a scientific background and much appreciated your solid empirical approach (what a lot of work!).
Scott McMorrow ·
Nice work, Roger. What a tremendous business you have that allows you to pursue your hobby in such detail. That you can turn this hobby into a very excellent money making business is just fantastic.
Your test methodology certainly allows you to see through to the Emperor’s Clothes. Our brains are generally not wired to perceive randomness in the world, which is why, without a scientific education, so many have trouble understanding the concept in photography. An interesting book on the subject is “Fooled by Randomness: The Hidden Role of Chance in Life and in the Markets” by Nassim Nicholas Taleb.
Halliday ·
That’s pretty interesting. As a note though, I’d like you to clarify the axes on your plots. I’m confused about what you’re plotting there, and it’s not making your point well without clearly stating the specifics.
Roger Cicala ·
Halliday – good point. I used some old graphs from the time when I couldn’t label axes easily. The vertical axis is the average MTF50 of the lens at 16 points. The horizontal axis is the peak MTF50 in the center.
Roger
David Stock ·
Thanks for this article, Roger. The revelation about “compensating elements” is fascinating. I wonder what kind of tech or craft is needed to adjust all the lens variables to optimum at the same time using these elements.
Frank Kolwicz ·
And then there is the matter of getting the manufacturer to *make* the needed adjustment.
Following a comparison of my Canon 600/4 LIS (I) with a comparable model from you I found that my lens was soft at longer distances, but OK when I did the testing in my backyard, which limited distances to around 40 feet. Unfortunately, I didn’t realize this when the lens was returned to Canon 4 times, at that time I had supposed that they would have actually tested the lens thoroughly because of my repeated complaints, not just run some rudimentary examinations and send it back.
Thanks to you, I have a better idea of what went wrong with that process, but now I’m so bummed out that I can’t bear going through the whole process and expense all over again without any assurance that the lens will be fixed.
At one time in the process I considered selling all my Canon gear and switching to Nikon, but a couple of knowledgeable people disabused me of that idea with their remarks on Nikon’s customer service history!
Thanks for bringing a knowledgeable outsider’s viewpoint and skills to this whole area of unbridled guessing, supposition and corporate secrecy.
Roger Cicala ·
Frank,
One thing I’ve found helpful is to be very specific about what kind of optical problems you’re having. You’ve probably already done this, but saying “center gets much softer at distances greater than 80 feet”, or “left side much softer than right” gives the tech a chance to diagnose it in the 15 minutes or whatever is allotted for evaluating the lens.
Roger
Siegfried ·
Roger,
a great stuff as usual. On a side note I’d say that it would be a little bit better (read: more illustrative) if you added a graph with 0-1200 scale into the 1st (“Sample Variation is Real”) and the 2nd (“Can You Really See the Difference?”) sections to supplement the original one featuring 500-1100/400-1000 scale.
And I’m sure you already have thought about going into lens calibrating business. Does the fact that we haven’t yet been offered with that service mean that you decided to defer or you’re steaming it up and opening in a month or two?
Cheers,
Zig
Roger Cicala ·
Zig,
We have looked into it and continue to do so. But the simple reality is the expense of spending 3 or 4 hours to make a lens as good as we can isn’t financially realistic. But we continue to look into ways to make the process faster and more accurate.
Roger
BMMS ·
Hi Roger,
what kind of variation do you get when measuring the same lens? Do they change over time and how fast?
Thanks for your posts<;
Bruno
Roger Cicala ·
Bruno,
We see some get suddenly worse, but assume that is from being dropped or internal parts wearing out. We’ve never noticed anything like a slow deterioration and certainly no slow improvement.
Roger
Randy ·
Thanks, Roger. As I have long suspected, the difference between an outstanding lens and a mediocre one may be effort and time taken, not just the design. Brands like Sigma & Ricoh, which were associated with so-so products seem capable of great things, if the price is right.
Too late to tell now, but I always wondered if the lenses Linhof and Sinar sold with the camera maker’s engraving added were actually better than a non-hand picked Schneider or Zeiss lens.
Silvio / KH ·
Ahoi,
thanks for your article! While I understood most of it, I think it would be helpful to explain the diagrams a bit more, or link to older explanations, if you have them.
For example why are there line numbers on both sides of the diagram, what do they represent? Worst and best (edge, center) of a single lens?
Also the very colorful one takes that to the third dimension to confuse me even more 😉
Thanks!
Ilkka ·
What you say makes a lot of sense to a fellow engineer.
Just a thought, since you have the equipment and some skills. Why not make a side business, Lens Repairs, where you take in customers lenses and evaluate them for a fee against your lenses, and if it makes sense, help adjust them to improve them. Time is money, but a decent day rate for your work is not that much. I mean, we are not getting into cinema gear prices. Testing is quite fast. It can give positive assurance for a customer that his lens is ok, or is a dud. He can then send it to manufacturer for warranty repair. And if somebody is willing to spend more to improve his lens, you could help to do that maybe for a few hundred bucks, or so. As you said, the manufacturs will never do it, or even admit something is wrong unless it is so gross that their blind auntie can see it with her walking stick.
Anon ·
You boast about your scientific background but you have’t labelled the axes on your top graph or even explained what it shows. It’s next to useless!
RussellInCincinnati ·
A beautiful article, congratulations. And lots of little details all worked out. Also a great stress reliever for people who scrutinize individual lens test charts, imagining that small differences in tests of a single sample of a mass-marketed lens are statistically significant. You make it quite clear just how much or how little can be reasonably concluded by a test of a single lens.
Nqina Dlamini ·
This is why I come here. I’ve been waiting for an article from you for a while now. Thank for this article, enjoyable and informative.
Kenny ·
What a great read, Roger. Thanks.
intrnst ·
If you excuse me, Roger, I’ll join Dlamini:
It’s been almost a month.
Work less, write more — if I can ask for.
Thanks.
Roger Cicala ·
Diamini and intrnst,
I know – it won’t happen again 🙂
I’ve actually been travelling all over the country looking at these various testing machines. I’m done now, so writing schedule is back on track.
NancyP ·
Thanks for the well written article. I enjoy the views into the “innards” of lenses and cameras. By the way, one of my pet peeves about most “comprehensive” lens reviews is the absence of comments about coma. Point light sources look silly with “butterfly wings” from large coma.
Tim D ·
Is there any truth to the idea that older lenses of the MF era of machined metal lenses with little to no circuitry have *less* sample variation due to simplicity and the good ole days where things were built to last, less focus on cost cuts yadda yadda, or is it typically the complete opposite where modern technology, automation, etc has really reduced sample variation over time? Are there certain much older lenses that somehow were built or designed in a way that they rival anything designed recently?
Roger Cicala ·
Tim,
It may be true, but largely to the extent that the lenses weren’t as sharp (film was more forgiving) and had fewer elements. We actually see some impressive differences in copies of older lenses, more than today, but that may also be just use over the years.
David Fletcher ·
Hi Roger,
Firstly – massive thanks, long time lurker first time poster. I find this blog fascinating – appreciate the methodical scientific approach, love the accessible/humorous/authoritative style and envy your access to toys 🙂
Is there an effective way we enthusiasts can assess how our lenses are performing and then fix.
For example I’ve got a A-Mount Sigma 24-70mm f/2.8 that I bought used and I’ve probably knocked it around for a fair bit with extensive usage (I’m clumsy). I suspect it’s now not performing as well as it could but I don’t have a point of reference.
Whilst I’ve had lenses fixed when problems develop I’ve never got a functioning lens serviced. If I sent a working lens to a manufacturer for servicing are they likely to analyse it’s performance and adjust accordingly?
Fletch
Roger Cicala ·
David,
If it became out of sorts being knocked around there’s a very good chance one of the small parts holding an element in place is broken and can be fixed. It really helps, though, if you can tell them exactly what you’re seeing optically. Just saying ‘the lens seems soft’ is almost a guarantee they can’t figure it out. If it’s soft on the left side at 70mm, but good at 24 they’ll be much more likely to fix it.
Roger
intrnst ·
Hmm… More goodies and good news.
I happy!!!
Don Cox ·
First class article. One of your best.
Nobody else is doing anything like this. Decades ago, Geoffrey Crawley, when editor of the British Journal of Photography, took a similar scientific approach to lens testing. But you have taken it further.
Stefan Janse Van Rensburg ·
Hi Roger,
Very nice article illustrating an important point. Thanks.
Is it possible for you to share some of the raw data / figures? I’d like to incorporate this into the introductory statistics course I teach.
Kind regards,
Stefan
Ilkka Nissilä ·
I am wondering if the sample variation in MTF50 is correlated across the focal length range of a zoom lens i.e. a lens that is a top performer (in terms of sample variation) at 70mm, is it also top performer at 24mm, or is there a compromise i.e. one lens sample is better at one focal length than the majority but not as good at other some other focal length?
It would also be nice to see how much sample variation there is in a relatively simple, well built prime lens instead of a highly complex zoom lens that is designed as much for versatility as quality. Also, how much of the sample variation is due to errors in element geometry and positioning and how much is related to variation in the material properties of the optical elements?
Roger Cicala ·
ilkka, I can say that good performance at one end does NOT predict good performance at the other end. At the extremes, it may be inverse, (meaning the very best at 24mm will probably be one of the worst at 70mm) but I can’t say with mathematical certainty.
The prime question is interesting. f/2.8 primes seem to vary less than zooms, but f/1.4 primes nearly as much. I assume the greater aperture means more opportunity for small aberrations to cause large variation.
As to the reason, I can’t say at all, I have no idea.
Roger
WT21 ·
Roger, you and your team are awesome. Thanks for these articles.
Nqina Dlamini ·
I can’t wait for the next installment of whatever subject you will tackle next.
Mika ·
Thanks Roger, again for the statistics.
Yes, I’d think that good tele end in a zoom would indicate a worse wide end.
What it comes to primes, Roger is again right on the wider the aperture, the bigger differences in the performance.
For a short rule of thumb, the spherical aberration is proportional to the cube of the aperture height, meaning that my job becomes about eight times harder when I need to go from F/2.0 to F/1.4, assuming equal performance otherwise (usually it’s not).
So thinking that there is already an economic way of doing adjustments and components up to certain tolerance, and the same process is used between higher and lower aperture ratio objective, it is very likely that the faster objective is not corrected as well, even though it has been adjusted up to the same amount of microns or degrees.
shorebreeze ·
Thanks for the article. One thing I’m curious about is my overall experience with Nikon has been that I’ve had fewer problems with “consumer-grade” glass than with pro. Is this just a matter of “less complex stuff to go wrong”, or “farther away from the bleeding edge of design”, or superior quality control in Nikon’s overseas plants especially Thailand? The pro-grade lenses, including multiple 2.8 telezooms and the 12-24/4, have had mis-shimmed mounts, evidence of possibly wrong spacing and so on. About the worst I can say about any of the consumer stuff is the somewhat mediocre performance of my 50/1.8 wider than about f3.2. Otherwise it’s stuff that I’d basically expect from the MTF, such as CA adjustments here and there or occasionally having to boost contrast in post.
Claudio Costerni ·
Hello Roger,
I have read all your article, a report at times stimulant, at times demeaning like a disease.
Have not time to read all the comments of your readers (also because English is not my native language), probably I could appear repetitive, but I want to say sincerely thanks for this: very well written, very understandable, very enlightening!
Now I do not know whether to be more quiet or be scared, after long thought of sending laboratories to repair some of my lenses and not have done yet, at this point, perhaps the only or the first one I will ship for a good calibration is the Canon 24-70mm f/2.8 MK I, even if I’m not using Canon cameras from 3 years.
Stephan Kuhn ·
Hi Roger
Thank you very much for your research and info. A suggestion: My understanding is that the above 2-axis graph also incorporates the AF variation you speak of elsewhere. To show the true extent of lens resolution variation and strip out the AF variation from your 2-axis fraph above, would it be possible to AF each lens say 10 times and average those 10 results out to get an accurate resolution figure for each particular lens, and repeat for all other lenses in the sample group?
Roger Cicala ·
Hi Stephan,
We do not use AF for testing – it’s too inaccurate. We manually focus, then use a focusing rail to ‘focus bracket’ multiple shots around that point, plotting only the best focus point for each lens. Our goal is to isolate the lens capabilities as much as possible.
If I did 10 AF shots for each lens, the plots would fill the graph. AF variation for any one lens is about 50% as great as the optical variation for all of the lenses.
Roger
Stephan Kuhn ·
Hi Roger (spelling of “graph” corrected)
Thank you very much for your research and info. A suggestion: My understanding is that the above 2-axis graph also incorporates the AF variation you speak of elsewhere. To show the true extent of lens resolution variation and strip out the AF variation from your 2-axis graph above, would it be possible to AF each lens say 10 times and average those 10 results out to get an accurate resolution figure for each particular lens, and repeat for all other lenses in the sample group?
Rob S. ·
When you measure lens performance and plot sample-to-sample variation, I wonder how a somewhat decentered, but otherwise “good” lens would show up. Say, a lens with good overall performance but a completely blurred outer left edge or upper right corner. Especially when the blurred upper right corner comes with a sharper-than-normal lower left corner; something I observed more than once when I found I had bought a decentered lens. For purposes demanding a certain minimum of image quality over the whole frame, I’d label such a lens “bad”, and, of course without having your huge amounts of data to judge from, my impression is that it is one of the rather more frequent lens problems to be found in the real world. How would your measurements and statistics reflect something like that? When plotting sample variation, would such a lens even show up as a “bad lens”, or wouldn’t it rather still be found within the large group of somehow normal samples?
Roger Cicala ·
Rob, in most cases of a slight tilt, where one corner is bad and another better than average, the lens would still graph as OK on this chart. Reality is, though, that is very rare. With just a little more decentering the center is OK, but two corners or an entire side are bad, the other side average and the lens shows up as bad. More commonly still is a lens with an entire side that’s awful and a center that’s below average. Most common is an average center with bad problems in all areas off center. Both of those would show up as really bad overall.
The kind of thing you see varies a lot depending on what lens you’re testing, too. Wide angle, wide aperture primes (24mm and wider) almost all have one weak corner. So for those, a measurably bad extreme corner is really normal at f/1.4 (usually clearing up at f/2 or so). Telephoto primes are rarely decentered. Zooms usually have a weak spot somewhere in the zoom range. Then you add that our testing is at one set distance, but the focusing elements may be decentered at another set distance, etc.
It becomes quite complex quite quickly. Which is why testing isn’t the end-all, be-all. Taking pictures is.
Roger
Mowl ·
Roger, could you please make a scatter plot with performance at 70mm (average of both values showed above) on one axis and performance at 24mm on the other axis. Then it would be rather easy to determine if there is some correlation or even negative correlation between these performances.
Here I expect that good lenses at the long end are often also good lenses at the short end because the design would be such that both ends should be good for a properly aligned lens.
Another interesting thing (provided you have the numbers) would be to check the center vs. the border performance by a similar plot. As you showed here it may be a compromise in lens design. So there should be some negative correlation between center and border performance.
Roger Cicala ·
Mowl,
I could do that for center sharpness or average sharpness, but that gives a very limited picture. As you can see in the current graph, center sharpness and average sharpness have an incomplete (although related) correlation. But having run 1,000s of zoom lenses through testing I can assure you the correlation of center sharpness, average sharpness, etc. at 3 positions along a zoom is a weaker correlation than center to average sharpness at either end. Perhaps a bit, but nowhere near 1:1. Nowhere near 0.5:1 even.
Not surprising, since you have to consider large moving metal barrels on rollers are part of the zooming (even internally zooming lenses) and they can’t possibly be as accurately made as optical elements. In fact, when we have a ‘bad lens’, one that is optically awful, the zooms are usually (about 65%) bad at only one area of the zoom. They’ll be perfectly fine at another area or the zoom range.
Finally, we have to add yet another limit of testing: focus distance (another moving element). Imatest can only test at a couple of distances (both of which are fairly close). Bench testing is at infinity only. I can say (working on it now) that particularly with zooms, the best copy up close is often not the best lens at infinity, and vice versa.
Like the article title says, there is no perfect lens. I could have gone further: there is no best lens. The best lens close up isn’t the best at infinity. The best at 70mm isn’t the best at 200mm. The sharpest in the center isn’t the sharpest in the corners. And you have to bench test to split these hairs. In picture taking reality the differences are very, very slight.
Roger
François ·
Amazing quality article, thank you ! It will help me focus on my photography and less on my lens.
Aaron Shepard ·
Roger, after reading this great post, my question is: Can I hire anyone to adjust my Nikon 70-300 zoom so it’s sharpest at the long end, where I mostly shoot, instead of at the wide? I’d really prefer not to start lugging an 80-400.
Roger Cicala ·
Aaron, not yet, anyway. But it may be possible in the near future. I’m still doing a lot of investigating into this stuff.
Roger
TBannor ·
Great article Roger. I agree with your assessment of manufacturer service facilitys’ performance in adjusting lenses for even sharpness. In my experience they’re not that great.
I’m curious, can a lens be adjusted for chromatic aberration? I have a sample of a recently introduced zoom that I bought after reading several reviews and it seems mine has way more CA at the wide end than what was reported in the reviews.
Roger Cicala ·
Todd,
It can be done in some cases. Lateral chromatic aberration is just another aberration. If the lens is supposedly good in that area by design, but your copy is bad, it may be that an adjustment of a compensating element could help. It depends on the lens, though. Some don’t have compensating elements that would affect that (heck, some don’t have compensating elements at all).
mike ·
someone could make a fortune if they sold lenses after testing them. provide the testing graphs, showing how the lens you are buying compares to others copies. You could charge more for a better copy, and guarantee no lemons.
TigerBalm ·
Firstly, great article, thanks for the hard work as I think it’s great to get some science behind what is usually a very common concern.
However I think you missed a real opportunity here to make the point that, as consumers, we really should know what we’re buying or renting when we get a lens and be reassured that we’ll get ‘at least’ that level of performance.
Just like most Broadband speeds are based on a ‘up to’ claim (rarely achievable) lens manufacturers should be made to put objective, measurable specs on their lenses that don’t promise an ‘up to’ level of resolution and performance but a guaranteed minimum.
Then, with improvements in quality control, manufacturing processes and general advances in technology they’re free to raise their minimums’ as competition/price takes hold, offering the better lenses at higher prices (think CPU marketing/pricing – a common practice we all buy into).
After all, what’s to lose?
Virginia ·
Starts right off with a typo? Imatest
Roger Cicala ·
Hi Virginia,
I’m missing the typo. Imatest is spelled correctly. Is there another I’m missing?
Ken Phillips ·
So … how much will Lens Rentals charge me to tweak my 70-200, or 600/4? Seriously … both have been apart (by me) to repair/replace the IS units. They both seem fine to me – I’m NOT a pixel peeper, but for a reasonable price (a few hundred bucks each) I’m in!
bison ·
Related to what mike and Tiger said: lenses could be tested, rated, and marked by the manufacture as gold, silver, etc. and priced accordingly. People who want the best and don’t mind paying for it get what they want, and people who just want something that isn’t terrible save money. Everyone wins.
Mika ·
Hi, since you guys have been opening the lenses quite a bit, have you ever noticed a growth of tin whiskers in older autofocus PCBs? If you are not familiar with the term, it refers to small strands of tin (and I mean really small) short circuiting electronics.
Yoda ·
After reading this I am sticking to my 8×10 pinhole.
Rck ·
I would like to learn which of the imperfections can be compensated by software in post. The copy to copy variation should be able to be reduced considerably if it results in detectable image changes. Software calibration by serial # should be much less expensive than tolerance reduction.
MarcosV ·
As always, an excellent article.
I was curious:
Are “pro” grade lens typically easier to adjust into what should be acceptable performance for that particle model?
Also how well do Leica lens do vs. other brands? I’ve always wondered if Leica glass was worth the price because of superior design resulting in lens holding their performance better between factory adjustments or if they were better tested before shipping.
ZDR51 ·
As a distributor of a major lens brand, this is a great review and sheds light onto why no one lens is “perfect”. Many who pixel peep their lenses often do not know what they are looking for, especially when using low quality monitors. And then there is the camera itself with their own set of “tolerance errors” that happens in manufacturing. In our experience we have seen cameras that are “out” and the lens is fine but people just want to think it is only ever the lens and argue that point. Good to see you do a write up on cameras like this too…
Roger Cicala ·
mjosephs,
We did some camera variation tests a year ago, shooting the same lens copy on multiple cameras. Camera variation was quite significant too, and that was using focus bracketing best shots. If you add focus variation into the mix, camera variation is at least as great as lens variation.
eric weiner ·
What a pleasure to read such a concise informative article on such a misunderstood topic. I have always wondered whether I should spend more rigourous time testing each lens that I buy. You have relieved my worry. Thank you.
Graham Serretta ·
Thank you, Roger, for a superb article. Bravo! I will keep it in my reference library.
jack burson ·
Again, you are providing a real service to the photography community!
THANK YOU! Your time & efforts are much appreciated.
AJ ·
And just when you’ve gotten all the adjustments corrected and the tolerances perfect, the temperature changes and differential expansion/contraction of the materials used in the construction throws everything out again 🙂
Once again, thanks for a very informative and comprehensive review of a photographic topic, Roger.
Always appreciate the time and effort you put into these.
Daryl ·
Great information, thank you! I have been grappling with this problem with several lens purchases lately, mostly primes that have a great reputation. Given that sample variation may be quantifiable while photographically insignificant what difference in mtf curves becomes significant when comparing different lenses?
Roger Cicala ·
Daryl,
I think each of us has to arrive at our own answer depending on what we shoot and how picky we are about it. My own rule of thumb is a minor difference (I’m generally comparing side to side) that disappears one stop down from wide open is absolutely fine for me. But truth is it often comes down to something like “I want the good corners on my landscape lens and will take a bit less resolution”, or “I want great center resolution in my sports lens and don’t mind if one of the corners is softer”.
pj ·
Exceptional and eye opening article. Thanks,
David Eichler ·
Are there services other than the manufacturer that will adjust lenses that are out of alignment, when a lens is out of warranty? Specifically, I have a Canon wideangle zoom that exhibits uneven sharpness from one side to the other at all focal lengths and many real-world distances, even when well stopped down to f:11.
Roger Cicala ·
David,
There are lots of independent repair shops, but they vary widely in what their optical capabilities are. Many have, at most, a simple test chart. If something is broken in the lens (a collar, helicoid, etc.) then chances are high anyone can get it back in good shape. I’d call the shops first and see what their capabilities are. At minimum they should have a lens-test projector with a Canon mount.
Roger
Lynn Allan ·
Nit?
The 2nd from the top lens element looks to also have a centering error relative to the top element. However, it is not as obviously decentered as the lens labeled #3.
LaszloPhotographer ·
Wow! What a carefully written and thoughtful article. I have often wondered about such things during my 50 year career as a photographer. I am much enlightened. It was especially surprising to learn that perfect adjustment of lens elements might actually degrade overall image quality. Apparently lenses are no different from most things in life: effectiveness is based on achieving the right set of compromises not on perfect measurements.
Hunter45 ·
“oval brash washer”? How bold, how showy of that washer.