Have You Seen My Acutance?
Have you seen my acutance? A few words about sharpness and MTF charts
Many of you know one of my pet peeves is strident internet arguments between photographers who are splitting hairs or misinformed. One major cause of these arguments is terminology: people use a nonspecific term which means something different to each of them. Others join in because the term means something slightly different to them. Pretty soon all are convinced all the others are idiots who just don’t understand. Its amazing, really, what a poorly defined term can do to take an interesting discussion and turn it into a screaming match. As Justice Stewart once said when describing pornography: “I can’t define it, but I know it when I see it”. Unfortunately, we all see things a little differently. When we can’t define a term, even though “we know it when we see it”, pretty soon we’re comparing apples and oranges.
One of the terms we photographers use that way is sharp. Seems simple enough—we all know a sharp photograph when we see it. Everybody wants a sharp lens. But it really means different things to different people. Lets be very superficial first. I have a friend who says his Canon 28-135 is very sharp. I’ve shot with several copies of that lens and never thought it was more than adequate. But he hardly ever makes prints, he posts his photographs online. And he shoots on a crop frame camera. I make mostly large prints of the shots I like (11 X 14 and up) and shoot on a full frame. So there’s the first misunderstanding. My definition of sharp is “What does it look like shot on a full-frame camera and printed to 11 X 14.” His is “What does it look like downsized and displayed on the web.” But sharp is a term that can lead to a lot more misunderstandings than just that.
Lets get a bit more scientific here. What does “sharp” really mean in photography? This is quite a complex topic if you want to get into it: we could discuss circles of confusion, Airy patterns , even Nyquist-Shannon theory and Rayleigh criterion. We could, but we’d all be bored to tears. Especially me. (And truth be told, I’ve read about that stuff a dozen times and I’m still not sure I understand half of it.)
So lets go for a more practical definition. There are two related, but slightly different things that determine ‘What is sharp?” They are Acutance and Resolution. Once you know what those are you will understand related terms like microcontrast. One more paragraph and you’ll understand that ultimate photography term modulation transfer function (MTF). And with just a little more reading, you’ll understand what those “MTF charts” really tell you about a lens.
What I’m offering you here is a veritable Rosetta Stone of sharpness terminology. After reading this little blurb, my friends, to the amazement of your supporters and chagrin of your adversaries you (YES YOU!) will be able to log on to your favorite photography forum and say things like “As you can clearly see from the MTF chart the lens has excellent acutance and microcontrast in the center but is going to exhibit softness and distortion at the edges and corners that would limit its usefulness for landscapes. Plus it will have harsh out-of-focus highlights wide open”. Is that great, or what?? Oh, yeah, I forgot. You’ll also be able to make better choices about which lenses you want to try without relying on someone else’s opinion quite so much.
Acutance and Resolution
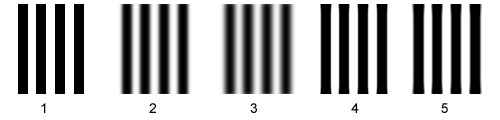
Sharpness, as we discuss it in photography, is made up of two components: Acutance and Resolution. Acutance is about how sharply an edge transitions. Look at the figures below. Figure 1-1 has a high acutance, the transition from white background to black bar is sudden and complete (it represents a very good lens). Figure 1-2 has a bit less acutance and figure 1-3 still less (representing a not very good lens). Now here’s the take home message about acutance: Figure 1-4 is just figure 1-2 with a moderate amount of sharpening applied in Photoshop and figure 1-5 is just figure 1-3 with a high amount of sharpening applied. When we sharpen, either in postprocessing the image or with in-camera sharpening, we have increased the acutance, one of the two components of what we refer to as sharpness.
Figure 1
If we make the bars from figure 1 thinner and closer together eventually we will reach a point where the lens can no longer tell that they are separate black and white lines — they will just look like a gray area. We can measure this point for a given lens (assuming we have a good camera, so its not the camera sensor that is the limiting factor) in ‘lines per millimeter’. (In case you’re curious, the terms ‘line pair’ and ‘line’ are used interchangeably for this purpose.) Resolution therefore is an actual measurement, given in lines per millimeter, of the smallest details a lens can resolve. It, along with acutance, is what we perceive as sharpness. Some people will refer to high resolution (the ability of a lens to show small objects clearly) as ‘good microcontrast’.
Figure 2
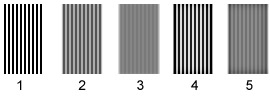
One important point about resolution and postprocessing must be made. Figure 2 is similar to the one we used to demonstrate acutance, but this time the lines are much smaller and closer together. Notice that figure 2-3, our symbolic not-so-good lens, is at the limits of its resolution: you can sort of tell the lines are there, but it really looks more like a gray box than black and white lines. Like we did with the first set images, figures 2-4 and 2-5 are the best Photoshop sharpening I could get from figures 2-2 and 2-3. Unlike the acutance example above, however, postprocessing can’t restore resolution very well. Figure 2-4 is better than Figure 2-2 but its still clearly inferior to 2-1. Figure 2-5 is a bit improved over 2-3, but not much and there are obvious artifacts. Unlike acutance, resolution (AKA microcontrast) can’t really be improved in postprocessing. If the image doesn’t have it, you’re not going to add it later, no matter how good you are. (BTW—resolution is very important in large prints, but not so much in online jpgs. For those acutance is much more important.)
MTF
MTF (modulation transfer function) is simply a way to measure how much resolution and acutance a lens has. The formula is simple: (maximum-minimum/maximum+minimum). To make it simpler lets say white = 1 and black = 0. For any line pair in Figure 1 and for Figure 2-1 the maximum for each pair is 1 (the white line of the pair is completely white, at least in its center) and the minimum is 0 (the black line is completely black). Therefore the MTF of a well resolved line pair is (1-0/1+0) = 1. When I check figure 2-2, however, the maximum reading in the lightest area is 0.67 and the minimum reading in the darkest area is 0.33 (the lens can no longer completely separate black and white bars, they’re both shades of gray). The MTF therefore is (0.67-0.33/0.67+0.33) = .34. Figure 2-3 has an MTF of .08.
So MTF gives me a number that tells me how well a lens can resolve black and white lines: 1 means it completely resolves them into pure black and pure white. Lower than 1 means they’re blurred enough that the white isn’t completely white and the black not completely black, but at an MTF of 0.5 for example, the dark part is twice as dark as the light part. I could still tell them apart.
If I tested the lens with two different size lines, say one set at 10 lines/mm and another at 30 lines/mm (remember the terms line or line pair both mean one black and one white line) I find two different types of information. The ability to resolve large lines clearly shows the lens has good acutance (AKA good contrast). The ability to resolve small line pairs (30 l/mm) shows the lens has good resolution (AKA good microcontrast). The two MTF numbers give us an idea of how well the lens resolves large and small objects.
MTF charts
The MTF number we discussed above tells us about one point on the lens. Lets assume the MTF test we just did was at the lens center and found the MTF for 10 lines/mm is .95 and for 30 l/mm is 0.7. That’s something I can compare to other lenses measured at their center. But as we know, lenses give their best resolution in the center — the edges and corners may not be as sharp. If I test the lens for MTF at various distance from the center I can graph the results and get a nice chart that shows me how good the MTF is from the center all the way to the corners, at both 10 l/mm and 30 l/mm. By convention, MTF graphs use thick and thin lines, like Figure 3 below, to represent the MTF of thicker (10 l/mm) and thinner (30 l/mm) lines. (Not every manufacturer does it, but it would probably be a good idea to also test the lens at its widest aperture and its best aperture, say f/8 for most lenses. MTF charts that do this will use one color for f/8 and another for the widest aperture the lens has. I chose black lines for f/8 and blue for wide open for this illustration).
Figure 3
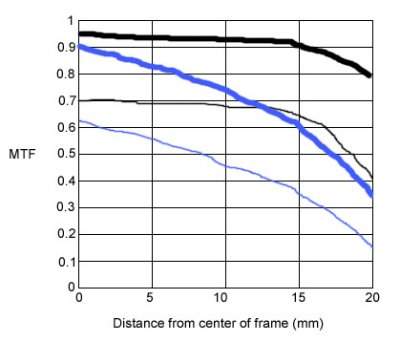
So what does this partial MTF chart tell us about our theoretical lens? It resolves thick line pairs better than thin, like every lens. At f/8 (black lines) its very sharp 3/4s of the way out from the center. After 15mm, though, performance, particularly at 30 l/mm, falls off. I’d expect the reviewers would say “A little soft in the corners, even stopped down”. The blue lines show us that wide open the lens still performs pretty well right in the center, but sharpness falls off steadily as we move away from the center. What does this mean in the real world? A landscape photographer who shoots at f/8 might tell me his copy of the lens is very sharp. So might a portrait photographer whose subject is generally in the center of the lens even if they use it at f/2.8. A wedding photographer who shoots tables of people during the reception at f/2.8 may well say the lens “is so soft its unusable” because the subjects at the edge of the picture are soft compared to those in the center. And all of them would be correct.
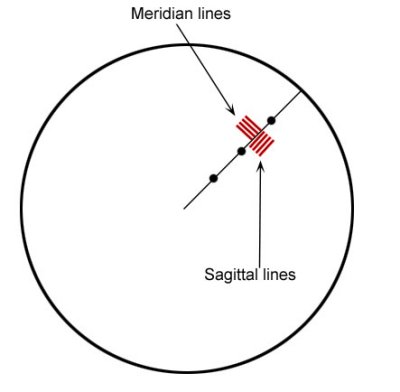
Actual MTF charts look a bit more complicated than the sample above because they contain one important piece of data I’ve left out so far. Real lenses have slightly different resolution depending upon which way the line pairs are oriented. If the line pairs are parallel to the radius of the lens (the radius is any line from the center to the edge) they are called sagittal lines (sometimes referred to as radial lines to help keep it confusing); if they are at right angles to the radius they are meridian lines (sometimes referred to as tangential lines). The figure below on the left probably explains it better than words. MTF charts will usually show the sagittal MTF as solid lines and the meridial MTF as dotted lines, so we get a chart like the one below.
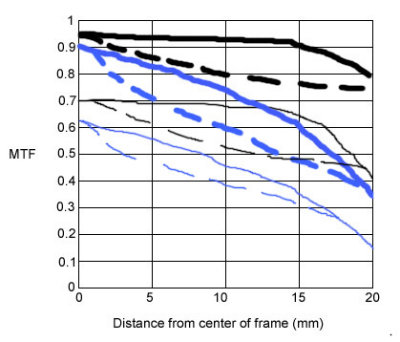
It looks a bit confusing at first, but actually its not. Thick lines are MTFs at 10 llines/mm (how good the lens’s contrast is) so we’ll start there. An MTF over 0.8 is excellent, one over 0.6 is good and below 0.4 is generally not OK. So we can see from the thick lines in the chart that the lens has excellent contrast at f/8 almost to the corner (black lines) and good contrast to between halfway and three-fourths of the way to the corner at f/2.8 (thick blue lines). The thin lines (showing the lens’s resolving ability) are good, but not excellent, at f/8 (thin black lines) and really not very good at f/2.8 (thin blue lines).
So what about the difference between the dotted lines and the solid lines for each pair, the difference in resolving meridian and sagittal lines? If the dotted and solid lines are close together, the out-of-focus areas of the lens will be smooth and pleasing (good ‘bokeh’), while if they are far apart the out-of-focus areas tend to be distorted and less pleasing (bad ‘bokeh’). There are some other significances that we won’t get into today like tendency to flare and smear, and certain types of distortion. The bottom line, though, is if the dotted lines and solid lines are close together that’s a good thing.
Some MTF comparisons
Its important to realize that MTF charts, while very useful, are also very limited. An MTF chart can show you the limitations of a lens, a bad MTF chart usually means a bad lens. On the other hand, a great MTF chart doesn’t always mean a great lens for every purpose. Lens coatings, focusing abnormalities, some forms of aberration, and a host of other things aren’t going to show up in the MTF chart.
It’s also important to not compare apples to oranges. In the old days lensmakers proudly displayed the MTF charts of their creations as measured in the lab. Not many manufacturers do that today (Zeiss and Leica are the only ones I believe). The other manufacturers present their data differently and use different methods to obtain it, so it can be misleading to compare MTF data from two different manufacturers. The MTF chart may be computer generated from a theoretical model, or may only show part of the data we discussed above. Canon publishes very complete charts with separate wide and telephoto charts for zoom lenses, but even they seem to have ‘lost’ the charts for certain lenses (the infamous 17-85 EF-S lens, for example, has no MTF charts to be found). Nikon and Sigma present the wide aperture MTF of their lenses, but not the f/8 data. Tamron and Tokina tend to not publish their MTF charts at all.
Even given all of these limitations, the data from MTF charts can still be quite useful. Lets look at a couple of real world examples from Nikon.
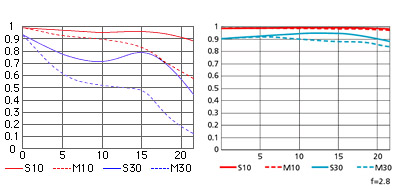
The two charts above compare two 400mm telephoto lenses. On the left is the 80-400 VR at 400mm. On the right is the 400mm f/2.8 VR. The 400 f/2.8 VR may be the best telephoto lens made and the MTF chart shows it: from center to edge the MTF approaches theoretical perfection. The 80-400 is actually no slouch: the 10 lines/mm pair (red lines) remains above 0.8 far to the edge, although the 30 lines/mm pair separate quite a bit and the meridian line drops below 0.6 fairly early on. From the MTF chart I’d realize the 80-400 can get good shots, especially if I stay centered in the lens. The separation of dotted and solid lines also tells me the out-of-focus highlights will be a bit more harsh on this lens, especially toward the edges, while the 400 f/2.8 will be very smooth. This is indeed what we see in the real world.
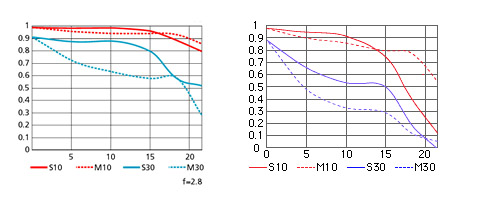
The next charts compare a pair of wide angle zooms at their widest. Wide angle zooms are more difficult to design and the MTF charts reflect it to some extent. On the right is what is widely considered an excellent wide-angle zoom, the Nikon 17-35 f/2.8 IS. Notice it keeps the MTF of the 10 lines/mm above 0.8 all the way to 15mm from the center. It doesn’t fare nearly as well with the 30 lines/mm MTF obviously. On the left is what is widely regarded as the finest wide angle zoom made: the Nikon 14-24 f/2.8 AF-S. It clearly does a better job with the 10 lines/mm MTF all the way out to 20mm from center, and is also markedly better at 30 lines/mm. While we recommend not comparing MTF charts between manufacturers (they don’t all derive their numbers the same way) if you look at some other good wide angle zooms like the Canon 16-35 f/2.8 or the Sigma 12-24 you’ll find their MTF charts are much more like the Nikon 17-35 f/2.8, showing just how great the 14-24 really is.
When you get a chance, take a look at the MTF charts of some lenses you already know and see how they compare with your experience using them. Canon and Sigma have the MTF charts of each lens on that lenses page on their website. Nikon USA doesn’t publish MTF data online, but the main Nikon site in Japan does (and its in English).
Oh, and one last thing: about my friend’s Canon 28-135, here’s the MTF chart from Canon’s website at both 28mm and 135mm. (In this chart blue lines are at f/8, black are wide open.)
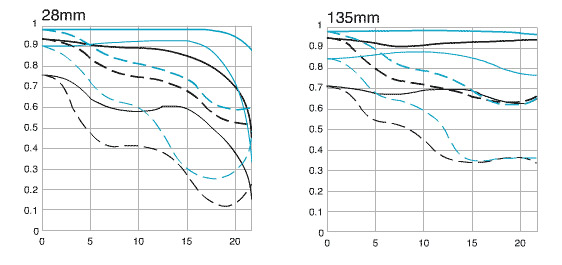
Notice the thick lines are really excellent out to 15mm from the center (which is all that matters on my friend’s 40D), both at 28 and 135mm? The 30 lines/mm pairs really aren’t so great, especially at the 28mm end. There you have it: my friend’s online images, with their emphasis on contrast and acutance look good and that’s his definition of sharp. My big prints from a 5D, with an emphasis on resolution and microcontrast, don’t look as good, and that’s my definition of sharp. We’re both right. But don’t tell him that—he’s busy having an argument about it in one of the forums and wouldn’t want any facts spoiling the debate.
Roger Cicala
Lensrentals.com
45 Comments
juergen gulbins ·
this is the best paper on mtf i have found. my compliments.
regards
juergen
Gokhan ·
could not agree with Juergen….
my compliments too.
Gokhan
tristan ·
Great article! Thanks.
Kent Calhoun ·
Excellent explanation and brilliant scientific presentation. I could not open the photos provided to actually see the text illustrations. I have a degree in photography and used the Ansel Adams Zone System, which is very concerned with MTF, tho not identified with that terminology.
I wish you could help me. In the old days, pre-digital, the more a lens was stopped down the sharper the images appeared. The sweet spot for most lenses was f11 to f22.
Is buying a Canon f2.8 telephoto opposed to buying an f4 or f5.6 worth the money when shooting sunsets at f11 to f22?
Do the elements in faster telephoto lenses significantly contribute to the MTF?
I apologise for asking these questions, but I am just an old man now, trying to get back to my first love, photography, and understand how she has changed over the years. Thank you for your kindness in sharing your knowledge.
Roger Cicala ·
Kent,
For center sharpness, f8 to f11 will be a great equalizer: most lenses do very well at those apertures. Depending on focal length, you may still see some difference between the expensive and not-so-expensive lenses in the corners and along the edges (wider angle lenses being more likely to show it). WIth digital cameras, diffraction softening usually starts to occur by f11 or so, and I really don’t recommend stopping down further than that if you can avoid it. By f/16 most digital cameras are clearly softer than they were at f8.
Regards,
Roger
Kent Calhoun ·
I got the photos to work. Great illustrations of your text. Thank you again for teaching us to see thru your eyes. Please answer my telephoto questions wheneven you find the time.
Sean M Posey ·
Thank you so much for your informative article. I’ve been shopping around for a new lens to shoot a friend’s wedding with and this will help me greatly. I keep asking advice from other photographers and they are giving me conflicting, painfully conflicting, opinions. I’m glad to see some objectivity is available. I’ve never once heard of MTF before today.
I’ll be placing an order with your company very soon.
Alexander Istratov ·
Amazing article about MTF charts, now I get it all !
Matt ·
Fantastic article; thank you!
Your statement that most manufactures publish their MTF charts based on theoretical models got me wondering. If you compared a model-predicted chart with one of experimental data would the only differences be due to experimental error and the degree to which the test subject matched its spec, or are there acknowledged deficiencies in the theoretical model? Does the model approximate or simplify real “perfect” behaviour?
Thanks.
Kong Chang ·
lots of info for a advance ametuer like me, loved it,and very educational.
thanks.
Bent Böhlers ·
Thanks for a realy good article. It is written so clearle and well explained, that it is understandable even for an amature that don’t have english as the natural language.
Jim Bentley ·
Nicely done! And thanks for the explanation. Cant wait to amaze my photo friends with the knowledge… LOL
John McLaughlin ·
WOW! You have made this seemingly difficult topic much more palatable and easier to digest. Thank you for your articles and your fair and balanced reviews on the lenses that you rent out. I will be doing business with you soon!
Dale Blevins ·
Once again you’ve made the most clear information available on a muddy subject! Thank You! And once again you’ve provided the ammunition (knowledge) to send me on the hunt for incredibly expensive lenses! 🙂 Thanks to this MTF info I’ve found the Canon EF 400mm f/2.8 L II, the charts are almost perfectly flat across the top with the lines just about merged. Shame it’s over $10K!!
Interestingly enough, I ran off searching for MTF charts on Canon’s EF-S 17-85 even before I was finished reading…couldn’t find em and found that out later in your article. Had me laughing for sure!
Keep up the good work Roger!
Dale Blevins ·
I did eventually find the MTF chart on Canon’s EF-S 17-85mm f/4-5.6 IS in their Technical Hall.
Here’s the web address for those interested….
http://www.canon.com/camera-museum/tech/report/200501/200501.html
Stephan Matthies ·
Roger,
I was directed to your site from “the-digital-picture”. I found your artical on MTF enlightening. Still I am confused. Maybe I read the charts incorrectly, but looking a Canons own charts at http://software.canon-europe.com/files/documents/EF_Lens_Work_Book_10_EN.pdf I wonder about the quality of some prime lenses in comparison (I know, only as far as you can get info from a chart). To my reading the 50 1.8 II is distinctly better than the 1.4 and 1.2 @ f8. Also comparing the 24 1.4 to the 24 2.8 it seems the 2.8 is winning hands down. The lens reviews at “the-digital-picture”, though, speak of different results using their test charts. What now? Ignore the mtf charts? Ignore all reviews? Buy all the lenses in question and test them yourself 😉 ?? I am thoroughly lost …
Roger Cicala ·
Hi Stephan,
It’s not unusual for wide aperture primes to be “tuned” so they aren’t as good stopped down to f8. At any rate, f/8 is the great equalizer: every lens should be really good there.
The charts don’t show, for example, the Canon 24 f/1.4 at f/2.8 (where it is actually quite a bit sharper than the 24 f/2.8 at f/2.8.
But the bottom line is MTF is just one more tool, and it assesses only resolution and generally computer generated “best possible” resolution. A lens review with actual testing will show other things, like astigmatism or aberrations that aren’t going to show up in the MTF chart.
Stephan Matthies ·
Hi Roger,
thank you very much for “lifting the mist” a little. I will be in NY from coming Sunday until the following Thursday. (Then it’s back to Ecuador.) So, I have done a lot of reading about lenses. I came across a lot of reviews praising Zeiss lenses over Canon lenses. I am seriously considering a wide angle prime where I do not necessarily need AF which means that I could choose between, say, the Distagon 21 mm and the Canon 24 mm. I cannot judge the build quality differences (if there are any) and I think the IQ is very much to individual taste. At the wide end I work a lot with my Canon 17-40. Most of the time I am happy with the results but there is the corner sharpness issue, especially in architecture shots. If I wanted to try for myself if the bang for the buck is really that great, is there a chance to rent a Zeiss Distagon for a couple of days in NY. Thanks in advance.
Stephan
bernard Yomtov ·
Excellent explanation, but please clarify a point about the sagittal vs. meridian lines.
It seems to me that any set of line pairs will be parallel to some radius of the lens, and perpendicular to another. In your diagram, just draw a radius shifted 90 degrees counter-clockwise to the one shown and the line pairs switch roles. Yet you refer to “the radius” as though there is a specific radius involved.
Is there some more precise definition of this?
Thanks.
Roger Cicala ·
Bernard,
Perhaps a better definition would be “lines that cross any radius, that is line that would form concentric circles” versus lines that go from the center toward the edge of the lens.
Roger
Murat ARIKUT ·
VERY INFORMATIVE. Now I understand a lot more. But still two problems persist, obviously better images seem to require bigger payloads (full frame SLR, preferably an arsenal of fixed focal length lenses, etc.) I still prefer the good pocket size (oly ZX1 currently). The second is, when enlightened with articles like yours I tend to go spec freak and lose grip on the pleasure of the experience. Thanks anyway. As I always tell my students knowledge is the only entity that gets bigger when shared.
cire ·
I find your article very informative and helpful, though i did not really understand the whole article it might help me in the future. Im just a newbie when it comes to photography, what lense do you recommend or a good lense that can be versatile while shooting so i dont need to change lenses and will only be using 1 lense. and also what do you mean by stopping down is this mean you stop down from f11 to f16 or f11 to f8 this is confusing for me though. Thx again to your articles i hope you could help me to enhance my skills in photography. thx again.
Larry ·
Answer for Matt’s question(above) please?
Roger Cicala ·
Larry, I must be missing something – I couldn’t find a question from Matt?
Freddie Parker ·
Thanks, I now have a clearer understanding of the MTF charts. Will now go and check my lenses.
Maji ·
Thank you for the great explanation. Very informative and well presented article of an extremely complicated subject.
Andy ·
Thanks for this article! Very well written, very informative.
RP ·
Roger,
Why Canon shows 2 continuous blue and black lines at wide and tele? What do they mean? Thick blue is f/8 at 28mm and thin blue what is it?
Phil Olenick ·
Brilliantly clear piece. I went looking for MTF charts for my Canon lenses, couldn’t find one for my new EF-S 15-85, which I got before opting for the new EF-S 18-135 STM “movie zoom” kitted with my new crop sensor EOS T4i (called the 650D, I believe, in most of the world) – trying to decide if the 18-135 is as sharp as the 15-85.
Before getting those this summer, I’ve done most of my shooting with the f/2.8 17-55 on an XTi (400D), which is beautifully sharp wide open – I hardly ever stopped it down. I traded in my original EF-S 17-85 and lots of additional moolah for the 17-55, which was well worth it.
I’ve found Canon’s MTF charts for all of those except the 15-85. Any leads to finding those charts? I’d also like to find the charts for the standard (not the DO) EF 70-300, which I also consider to be a very good lens.
Before finding this piece, my main source for evaluating lenses has been the interactive blur level charts at http://slrgear.com/reviews/showcat.php/cat/2, which show “blur” levels across the frame at different apertures and focal lengths as a color-coded surface with sliders for the two factors. (You have to click on the static image to bring up the interactive version.) I’d be interested in your reaction to that tool.
Roger Cicala ·
Phil,
I think that’s an excellent tool that SLR Gear has. Very intuitive. Blur index is proprietary, so we can’t know exactly what it measures (although some people say they’ve reverse engineered it) but it still gives a great comparison tool.
We have the wide end MTF chart for the 70mm: https://www.lensrentals.com/rent/canon/lenses/telephoto/canon-70-300mm-f4-5.6-is and 15-85:https://www.lensrentals.com/rent/canon/lenses/normal-range/canon-ef-s-15-85mm-f3.5-5.6-is-usm but I don’t have the telephoto end anymore. Not sure where they’ve gone. But you can usually find them at the Canon Museum EOS section.
Roger
Feng Chun ·
This is really a great post on MTF chart.
I have found your site from a forum and read your blog from 2012 till now. Really enjoyed it.
Anthony ·
Roger,
I was wondering if there’s any easy way to relatively convert between the MTF50 numbers you typically post in your articles, and the values in the MTF charts that the manufacturers provide? I tried posting elsewhere on a forum and got a 1200+ word essay “answer” on how Canon’s MTF charts are done (included mention of Airy Discs and comments asking if I know how to read an MTF chart or not. The general gist I’ve gotten is that either they’re two different systems and I shouldn’t be trying to compare them, or I don’t want to know the math involved.
Thanks,
Anthony
Eugene ·
I’m wondering how easy would it be to see MTF differences in your photographs. As I understand, digital cameras first blur the image (to prevent aliasing), and then sharpen it in post-processing. So if you look at the RAW image with no sharpness enhancement, then everything will look blurry. If you look at sharpened RAW images (which is what most people use), then differences in acutance might have been removed by the sharpening process. So how do you properly test your lens for sharpness?
Roger Clark ·
http://wordpress.lensrentals.com/2009/06/have-you-seen-my-acutance
Hello Roger,
There is a glass of algorithms called image deconvolution which actually do increase resolution in post processing, including resolving some detail beyond diffraction limits and 0% MTF. The science of image deconvolution is over half a century old. Two classic references are:
Richardson, W.H., “Bayesian-Based Iterative Method of Image Restoration”, J. Optical Society America, 62, 55, (1972).
Lucy, L.B., “An iterative technique for the rectification of observed distributions”, Astronomical J., 79, 745, (1974).
The research by Richardson and Lucy led to the impressive Richardson-Lucy image deconvolution algorithm that has been in use for decades in many fields, ranging from the tiny (microscopy) to the mega (astronomy). A google search with terms like:
image deconvolution beyond the diffraction limit
or simply
image deconvolution
will show many references.
From a practical standpoint, I have been using the Richardson-Lucy image deconvolution algorithm for many years in my digital post processing work flow. In general, on a low noise image I can improve resolution about a factor of two. I have a couple of articles on my (non-commercial) web site:
Image Restoration Photography Using Adaptive Richardson-Lucy Deconvolution part 1
http://www.clarkvision.com/articles/image-restoration1/
Image Restoration and Down Sampling Using Adaptive Richardson-Lucy Image Deconvolution Part 2
http://www.clarkvision.com/articles/image-restoration2
Also, a comment on your unsharp mask example. I feel it is a little deceptive because it is only black and white bars. One is able to clamp the levels back to black and white with unsharp mask quite easily. But one could do that too with a simple stretch. Try the following:
To a gray scale image, value = 128, add bright bars with value = 220 and dark bars with value = 30. Then blur with Gaussian blur. Now try and restore the image with unsharp mask. The result will not be pretty. Black and white bars are not a realistic imaging scenario, not even with zebras.
Roger Clark
Dee ·
Roger,
Thanks for your post. It’s really helpful for better understanding the concepts of sharpness and mtf for a rookie as myself.
I’m still a little confused on separating resolution and acutance on 30 line/mm MTF chart. Since worse acutance means the edge between black and white drop slower, which is one of the impact factors to lower contrast for tighter line pairs (reduce mtf). To me, mtf is an indication for resolution and acutance combined together, isn’t it?
I also read in some books that people measuring mtf by taking Fourier Transform of line spread function. It is equivalent to to take more data points in frequencies (line pair) at certain location instead of just two points (10 l/mm and 30 l/mm) as shown in mtf chart?
Thanks,
Dee
Roger Cicala ·
Dee, Brandon’s not around tonight so I’ll tackle most of the question and let him get into Fourier Transformations. MTF does give us a measure of both, if I understand your comment properly. The 10 line pair data correlates well with what we would call contrast or ‘punchiness’ in the photograph, AKA acutance. We like for the 10 lp MTF to be up above 0.90. You can sharpen and image and increase acutance pretty well, though.
For most cameras the 30 line pair data correlates pretty well with resolution or fine detail. The point at where the 30 line pairs /mm graph crosses under 0.5 is where (on most cameras) you are beginning to lose fine detail that you just can’t get back. That’s more to do with resolution. That being said, for a high pixel-density camera, like a 36 megapixel full frame or 24 megapixel crop sensor, the 40 or even 50 line pairs / mm data may be a better measurement of absolute resolution.
That’s the plain English version, which, as verbiage must when explaining mathematics, contains some generalizations. I’ll let Brandon give a more mathematical and accurate explanation later.
Roger
Dee ·
Roger,
Thanks for the quick reply. Please forgive me if my phrasing is odd, since english is not my first language.
What is ‘0.5mm’ you mentioned in this comment –
:”The point at where the 30 line pairs /mm graph crosses under 0.5mm is where (on most cameras) you are beginning to lose fine detail that you just can’t get back. ”
And later in that paragraph, for a high pixel-density camera (36 megapixel full frame), the pixel width is about 4.8 microns. So the fine line pair to identify the resolution limit should be close to the pixel width. Is my understanding correct?
Dee
Roger Cicala ·
Sorry, Dee, I was writing late at night. There should have been non ‘mm’ in there. I think I get so used to typing that I do it in my sleep. It should be MTF of 0.5
Oleg ·
Roger, thank you very much for your blog, it’s so informative!
Are you going to test Fuji lenses one day?
I’ve recently seen a post on official Fuji facebook page saying that catalogue MTFs don’t matter in real life – https://www.facebook.com/Fujifilmxworld/photos/a.434509496621859.99836.427388394000636/923260937746710/?type=1&theater
It’s no brainer that 15l/mm and 45l/mm graphs are not enough to determine whether the lens is good or bad. But I don’t like they don’t provide any MTFs proving the lens is good indeed, instead they just add some text. All in all it sounds like there is some magical image quality which can’t be measured which is of course untrue. Also their argument about “two dimensional subject” is weak I suppose. Also there are many lenses which don’t compromise on image border quality.
Could you please comment on their post? It would be very interesting if you would test this lens one day to check whether it’s results are much better when focused on close objects comparing to infinity and provide some detailed MTF graphs.
Roger Cicala ·
Oleg,
I read that post and I actually do agree with it. MTF, which I play with, measures one aspect of a lens – it’s ability to resolve (both in contrast and resolution). That’s very important but depending upon the photographer, subject, and technique, it may not be the most important and it’s not the only factor.
One thing I’ve found is sometimes (not always, but sometimes) the designer DOES trade off some resolution in order to achieve a flatter field, lower a certain type of aberration (which might improve booked), etc. Then again, a great designer often doesn’t always have to make that compromise. So I can certainly agree that you might prefer a lens with flatter field or less astigmatism to a sharper lens with a curved field and more astigmatism. Or whatever.
However, I do get a little nauseated when the marketing department has to use BS terms. It’s funny how one company waxes poetic about their 3-D look, the goal of all photographers. And another waxes poetic about their 2-D look the goal of all photographers. Etc. I agree with their facts, I get rather insulted when verbiage suggests I can’t understand the complicated optical stuff, I should just go make pretty pictures.
AJeng ·
Thank you, Roger, for the wonderful write-up on MTF, resolution, and acutance. I learned a lot today!
Many people refer the term microcontrast as the ability of a lens to transfer contrast of very small details. And they also claim that Zeiss prime lenses have more “3-D pop” because of high microcontast their lenses have EVEN if their resolution is lower than comparable Sigma, Nikon, Canon counterparts. This view is certainly in conflict with what you presented here as you referred resolution as microcontrast.
A blogger calls Sigma ART lenses (known for their very high resolution) produces flat images because their lack of microcontast (http://yannickkhong.com/blog/2016/2/8/micro-contrast-the-biggest-optical-luxury-of-the-world). The author said “Unlike measurable resolution, micro-contrast is perceptible not measurable.” Clearly, he is using the term microcontrast to mean depth perception, completely different than what you described here.
Is the 3-D pop claims by Zeiss users nothing more than snake oil? Or it is something measurable?
Thank you!
Roger Cicala ·
AJeng,
I think terminology is always a problem in discussions like these. Separating sharpness into acutance and contrast is a good first step. Micro-contrast is a term that I always ask people to define when they start using it. Some consider microcontrast to be the same as resolution – how fine of a detail can the system resolve. Others (trying to explain it in words is difficult) are considering it how contrasty a given fine detail is. I tend to like the latter definition, just because, well, we already have resolution.
As to 3-D pop being snake oil, no, I don’t think so. On the other hand it may be difficult to measure numerically, and unless everyone agreed on what they mean by ‘microcontrast’ there’s no way to measure it at all.
Roger
John Gaylord ·
The critical distinction between sharpness and micro-contrast is tonal separation — the ability of a lens to distinguish between tonal values in order to render the appearance of depth. We are not talking about black against white, but rather subtle differences in shade. I have noticed this is especially apparent in the shadow tones of digital captures, which can be rendered “flat” by modern lenses. Whether this can be measured I don’t know, however I can clearly see it in a direct comparison between images I have shot with different lenses of the same focal length in the same real-world scene & lighting with the same camera.
Roger Cicala ·
A very good point, John, and as best I know we can’t put a number on that or graph it, at least not very accurately. I always have looked at the stuff I do as sort of a screening: we want adequate resolution but that, in and of itself, isn’t everything.
Arun Gupta ·
What is the assumption about the brightness response curve of the camera sensor? Is it assumed to be or measured to be linear? No in-camera sharpening? etc.
E.g., a camera sensor with a binary response, i.e., that recorded white for every pixel above a certain brightness and black for everything below that threshold, would change the MTF.