A Data Processing Contest
OK, when I introduced our new optical bench, I mentioned that it generates a lot of data. We gathered data for a nice comparison test (I mean who wouldn’t want to know how the Zeiss Otus and Sigma 50mm f/1.4 Art stack up against some nice Leica 50mm lenses). Since then I’ve spent about 20 hours wading through data and trying different ways to present it. I’ll wallow through that article, but I can’t say I’m totally happy with my efforts.
A number of people have left posts that if I’d furnish them some raw data they’d take a shot at graphing and presenting it. Which seems like a wonderful idea, especially after I went cross-eyed over the holiday weekend trying it myself. So this morning Aaron collected a small data set that anyone who wants to play with is welcome to.
Basically we’ve tested 5 copies of the Sigma 35mm f/1.4 Art lens, and 5 copies of the Canon 35mm f/1.4 lens. We’ll limit this to just MTF numbers across the field (from side-to-side). Each lens is tested 3 times, rotating from 0 to 45 and then 90 degrees. (Since the optical bench makes one ‘slice’ across the lens, we need to take several slices to make sort of a 3-dimensional picture.) We’ve considered making a 4th slice at 135 degrees (180 degrees takes us back to zero), but have found after testing a lot of lenses we’ve never seen anything revealed at 135 degrees that the other three cuts don’t show us.
So if you want to participate, you’ll receive 2 Excel spreadsheets, one for the Canon lenses, one for the Sigma. Each spreadsheet has 5 lenses on separate pages, each page looking like this:
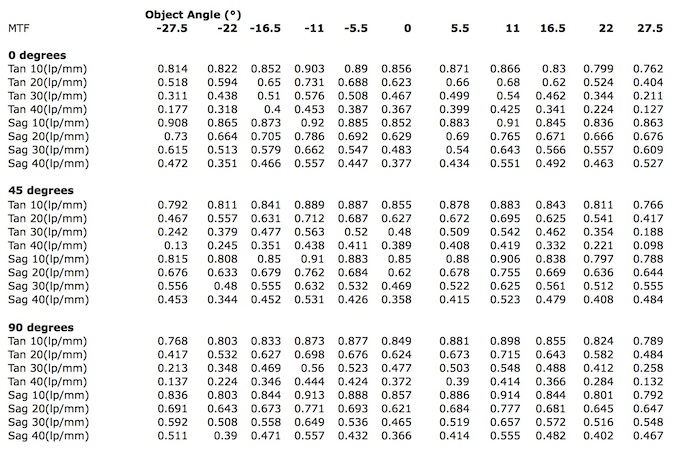
Object angle is simply the degrees off axis (“0” being the center of the lens). The other data is Tangential and Sagittal MTF at each position for 10, 20, 30, and 40 line pairs / mm.
The goal is to create a graph that shows the MTF across the field for each type of lens, along with some way of describing variation, and astigmatism. Then we should be able to compare the two types of lenses and detect any significant difference between the Canon and Sigma lenses.
Five copies is not a huge sample size, particularly for demonstrating range, but I wanted to start small and simple. We usually try to test about 10 copies of each lens when doing comparisons. I don’t expect anyone to find a statistical analysis that will actually differentiate scientifically with 5 copies, but I’m open to any attempts.
To make things more interesting, the 5 Canon samples all passed our standard testing (including Imatest) easily. The Sigma samples include one lens that was borderline and another that failed our other tests. My hope is that being able to detect the Sigma outlier will make certain your efforts are sufficiently sensitive to bad lenses. (Had this been an actual test, the one Sigma copy would not have been used.)
Let’s make it a Contest
I know some people will just enjoy playing with the data (btw, you’re free to use it anywhere you like, just mention that it’s our data when you do). But I’m hoping to get something out of this (an exceedingly easy, automated way to present data so that I can write blog articles by just pushing a button). So if someone comes up with a method I’m going to use, there will be a prize.
Actually, since I’m a history buff, let’s model this after the original French Society for the Encouragement of National Industry contest for a new photography lens and offer several levels of prizes. We may not award all prizes, or one person may win all three prizes.
Platinum Medal Prize: $500
To win the Platinum Prize you must write a program or macro that fulfills my wild fantasy – Aaron spends hours collecting data on dozens of lenses, then I push a computer button and beautiful, logical graphs are generated that are easy to follow, present the data and variation, and offers an easy way to compare different types of lenses. I will be a bit flexible on what constitutes pushing a button, but if it takes me hours, it’s not winning.
Gold Medal Prize: We will do the lens test of your choice (within limits of our mounts for the optical bench and lens availability) and a $100 rental credit
So if you’ve always wanted a comparison between the Canon 18-55 IS kit lens and the Olympus 16-50, or just want your ownt lenses tested, here’s your chance. To win the Gold Medal Prize you develop a fairly simple way to create logical, easy to understand graphs that demonstrate the variation of copies for each type of lens, and offers an easy way to compare different types of lenses.
Bronze Medal Prize: Our undying gratitude and we’ll test 2 of your lenses on our optical bench and provide you printouts.
To win the Bronze Medal you simply have to demonstrate a graphing method that presents the average (mean) results for multiple copies of a lens in a way that’s easy to follow and understand. If we use your graph methods, you win a Bronze Medal.
Enter Soon, Enter Often
To enter, just email me at Roger at Lensrentals dot com and I’ll send you the spreadsheets. Let’s put a June 15th deadline on submissions. And remember, an actual test run will usually be 10 samples or more of each lens, and for zooms will include test runs at 3 zoom positions, so whatever you think of has to be able to handle a lot more data than what we’re using on this trial run.
Roger Cicala and Aaron Closz
Lensrentals.com
May, 2014
30 Comments
Tom A. ·
I like how you have made the contest immune from the stigma and unhappiness associated with getting a silver medal. Sounds like fun.
Trond Roaas ·
The _ultimate_ prize would be if the winner could send in a lens of their own, and you could test and adjust it. This is what many, many of your readers (and customers) drool over – to get your equipment and expertise to asses one of their own lenses and adjust it to get maximum performance out of it. I know I would pay good money to get one of my own lenses tested and calibrated… 😉
Roger Cicala ·
Trond – Done! Any winner gets to send a lens in for testing – and we’ll adjust it if we can (some soft lenses can’t be adjusted). Was that easy or what??
Roger
Rory ·
It is going to be tough to “automate” given the way you are presenting the data in separate spreadsheets and pages. Can we assume that defining how the data is reported is okay? For example, I would suggest the data be reported in one (eventually) honking big table. Then I see you stroking your chin, emitting a hmmm or two, making a selection of what you want to compare from multi-select dropdowns and voila, graphs done. All this live linked to your blog of course…
Steve S ·
The contest is a wonderful idea; I’m a little too old and lazy to submit a formal entry, but here is a thought or two.
You have a lot of information about rotational symmetry of the image, essentially what we call centering. Probably one good way to proceed would be to try to distill this all into a single figure of merit for each specimen.
Yes, as you say the 135-degree measurements don’t tell you much you can’t already guess, but they really should be included so as to reduce starting position artifacts: as it is you are measuring two opposite quadrants of the image and it really makes sense to collect one-third more data to fill in the other two quadrants symmetrically.
Then you might just take the std deviation of the eight corresponding observations, eg sag 20 for -11degrees, +11degrees, for each of the four rotational angles. This will give you 8X5 different measures of decentering; just average these. This average is one number that expresses the asymmetry of the image resolution.
A vaguely analogous process could generate a single figure for curvature of field.
The difference between sagittal and tangential MTFs is a sort of rough and ready measure of a combination of astigmatism and coma. This too might be reduced to a single number by a similar process.
I’m leaving it to someone younger to deal with the embarrassment of MTF riches. Probably 10, 20, 30, 40 all treated equally is not the way to go? Maybe just 10 and 50 treated separately. “Contrast” and “Fine detail”? Dunno.
Certainly there are people like Falk Lumo and Jim Kasson who could help with this. I expect they would do so gratis, since the data you will generate is of so much interest to many of us.
Ernie ·
“Automate” shouldn’t be an issue anyone.
Stipulate input format as CSV, break files down by make/model, or go all crazy with smaller CSVs that are by serial number.
Also, I’m guessing that’s an Excel-ism where we’ve got 1 and 2 decimal degrees for a few numbers?
mrc4nl ·
nice nice, i do follow a basic course of C# i must be able to write a program that generates graphs from data.
problem is i havent programmed anything amazing, just basic if else stuff 🙂
Aaron ·
@mrc4nl
This is more an exercise in data analysis and presentation, rather than programming. Not saying some decent programming knowledge isn’t good for this, just that primarily it’s coming up with a way to analyze and present the data, rather than how good a programmer you are. So give it a try! 🙂
David ·
Wow, a monetary prize. I thought folks would be happy to have the honor / bragging rights of having the resulting method/graph named after them… cash always helps too, of course…
John ·
After you’ve compiled this data and presented it in geeky graphs could you translate the information into a corresponding table where the lens is presented for we geek less readers. Something along the line of “Leica can’t make a lens this good down to don’t touch this with a ten foot pole”.
Thanks for the enjoyable read even if I have no clue what it is. John
Aaron ·
Roger, as I think about it a bit more, I think a 4th measurement at 135-degree rotation would be a good thing. That way you can get measurements for all 4 corners as well as all 4 edges on the field.
Roger Cicala ·
Aaron, might be, but in a reasonably centered lens, there’s little difference. A decentered lens never gets to the third position, it’s obvious before then. But you may be right – as our database grows it may be worth measuring all 4 corners.
Aaron ·
Oh, it’s obvious before then? But do you know which bit is de-centered? Or doesn’t it matter when adjusting the lens?
Roger Cicala ·
Aaron it’s almost always apparent at the first slice if things are really out of sorts – MTF values are low, one side is markedly different than the other, therer’s lots of astigmatism, etc. Even more subtle ones show up at 45 degrees or 90 degrees. So far we haven’t had one that only was apparent at 135. It may be that there are some that would only do that and it’s worth investigating, but the MTF bench is much, much more sensitive than anything else we’ve used. Even lenses that optically show just a bit of softness in one corner show far more issues on the MTF bench.
Aaron ·
Does it take that much longer for that extra run? I guess I’m just a bit of a data geek sometimes, and like symmetry 🙂
Roger Cicala ·
Aaron, really not much, a minute or so. I think it’s my attempts to keep the sheer volume of data under control. I admit I’m a little intimidated by having so many readings at my fingertips.
Roger
Aaron ·
Well, if you put it in a good data store and good data model and it’s easy to have available, without being overwhelming. Just takes a little bit of extra time up front to think things through, and likely an extra week or two to prototype some stuff out and see if it’s what you want.
Jesse ·
Would doing the tests at 0, 60 and 120 degrees make sense? Still 3 runs, but now symmetric!
Roger Cicala ·
Jesse, the 0, 60 and 120 degrees would be a good option. We started with 45 thinking that shows us an acual corner, but realy that’s not of any particular importance. And now that you’ve pointed it out, we’ve always just done them in order (rotation is automated). I’d have to check to see if any failed at 45 and passed at 90, but truth is almost all that fail have already failed at zero.
Jesse ·
If a lens passes at 0 degrees, is there every ones that pass at 90 degrees and then fail at 45 degrees?, or do you check 0, 45 then 90? I would think that there would be much more independent data at 90 degrees (Orthogonal), and I would be surprised if you found anything at 45 that was not apparent in either the 0 or 90 degree data. Expect maybe chips in the front element – that would through a wrench in everything…
MaxNoe ·
I would like to participate 😉
Maybe angles of 33 and 147 degrees would be interesting, as these lines would go through the corners of the standard 3:2 image corner
Josh M ·
Roger,
Is this the actual way the data comes out of the system… an Excel spreadsheet? There’s no “rawer” format?
Roger Cicala ·
Josh, there’s no ‘rawer’ form. We can basically get it out in Excel data, cdv, or as a web page with automated graphs. There are a lot of different tests we can run, but the numbers come out in Excel. Formatting for each test run is roughly the same, although, for example, we did our first test with 10 points measure across the front of the lens, and now we’ve increased that to 20 and reduced capturing 4 different lp/mm to 3 but that’s just more columns and less rows.
Roger
Josh M ·
And along with that question, if it comes out in Excel format, are the files formatted exactly the same? It’s relatively easy to extract data from those sheets… IF it’s standardised.
Arahne ·
Perhaps I missed hte point completely, but I think that this is specific way of mapping, so in that sense some way of presenting mapped points (areas in this case) within the given space, should be given good, mediocre, or bad characteristics.I imagine 3d surface with peaks above or bellow surface when numbers are not good. I suppose since this is a test, some data(numbers) are better than the others,so absolute good is presented as flat. Every number appart from absolute good should be presented away from flat. Flat, high peaks and everything in between should be given a colour, as it will make it visually more understandable. Like 3d version of field curvatures that You presented. I suppose that there is a way to use something like GIS application to translate this data to visual presentation, which will make all of this resolved with one press of a thumb.
Norbert ·
I also want to participate, if that is still possible.
Walter ·
Roger,
I’m curious why you’ve chosen to cut things off at 30 lp/mm in your newer data (i.e. the one for the Canon 50/1.2 that you sent me, which you imply is the same as the rest that you’re doing).
The naive Nyquist frequency for a 24MP APS-C sensor is 125 lp/mm, so MTF at higher frequencies (up to perhaps 60 lp/mm) seems like it would make quite an impact on the amount of microcontrast captured.
Roger Cicala ·
Walter, we haven’t really decided anything yet. But the reality is when we plan on showing multiple lenses in a graph with error bars, with 4 or 5 graphs all you see are the error bars and overlap. But I don’t really consider the absolute Nyquist frequency really practical other than in theory. I see the point of going higher than 30, but right now we’re just feeling our way along.
I suspect a combination of standard MTF bars and frequency graphs should give some indications for higher frequencies, and we’ll probably do that.
Heywood Jablome ·
I wouldn’t mind a copy of the data to see what can be done.
Some questions: Is the format final? That is to say, is the #sheets, #columns, #rows and their position in the sheet fixed? If not, are these values available somewhere in sheets (say, sheet1, CELL A1 to A3 or whatever)? Furthermore, is each such bundle of sheets always for a single lens? (That is to say, not sheet1-5 for Sigma, Sheet 6-10 for Canon, for instance)?
If this is already in Excel, if the data is structured enough, automation should not be difficult. Coming up with a reasonable visual representation might be, but the whole thing is a non-starter from an automation POV if you aren’t willing to commit to a specific data format. Not necessarily the one you have this very minute, but something.
Edmund Ronald ·
could you please email me the data? edmundronald at gmail dot com. Thx.