24-70 f/2.8 Zoom MTF and Variation
We’ve finished, mostly, our fairly long series of articles on SLR prime lens variation. We started with prime lenses for several reasons. They are much quicker (and quicker is a relative term here) to test than zooms. They are simpler lenses and we expected that meant they would have less variation. We learned a lot doing the prime lenses and now feel we’re ready to start looking into the more complex of zoom lenses.
Before we get ready, there are a few things that have to be mentioned. Many zoom shooters like to say their zoom is ‘as good as a prime’. It may be, depending upon what focal length you’re using and what lenses you’re comparing. It’s really unlikely if you are picky, but it may be true if you compare the right zoom to the right prime at the right focal length. Modern zooms are amazing lenses and the more I learn about optics, the more amazed I am that they can be as good as they are.
But there are some general realities of zooms that I want to put out here before we get started. If these facts raise your blood pressure and make you get all worked up, then there’s probably no reason to read further – you’ll just get upset. But if you’re the kind of photographer that wants to know the strengths and weaknesses of your tools so that you can use them best, I think you’ll find this stuff useful.
- Zooms, with very rare exceptions, are better at certain focal length ranges than others.
- Zooms are often as good as the equivalent prime in the center, but rarely as good in the edges and corners.
- Zooms, being more complex beasts, are going to have more copy-to-copy variation and are going to have a higher frequency of ‘bad copies’.
Remember, as always, that these results are from an optical bench, not from an Imatest or DxO lab. That means they’re going to be different than what we, or others, have previously published for a couple of reasons. First, this is a test of just the lenses, not the combination of camera and lens. These results aren’t influenced by comparing one lens on a certain body and another lens on a different body. Second, the optical bench tests at infinity focus, not 10 to 20 feet where most Imatest work is done.
MTF Curves
Today we’re comparing the Canon 24-70mm f/2.8 Mk II L, the Tamron 24-70mm f/2.8 VC, and the Nikon 24-70mm f/2.8 AF-S lenses. As we’ve been doing, the MTF curves are the average of 10 copies at each lens, with each copy tested at 4 different rotations. Each lens is tested at both ends of the zoom range and in the center of the zoom range. (BTW – I’ve tried a couple of different ways to present this data. Please give me any input you may have. But if you’d rather do direct comparisons, all these curves will also be up on The Digital Picture’s MTF Comparison Tool.) For those of you reading on small screens, I’m afraid you may have to scroll back and forth a bit to see all three MTF curves, but putting them three abreast makes the comparison much easier.
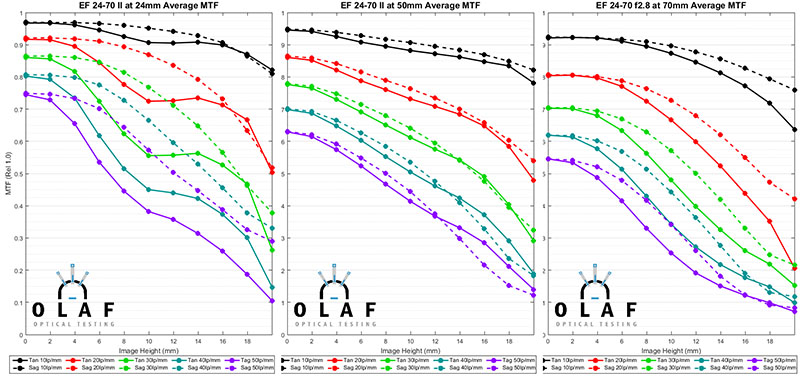
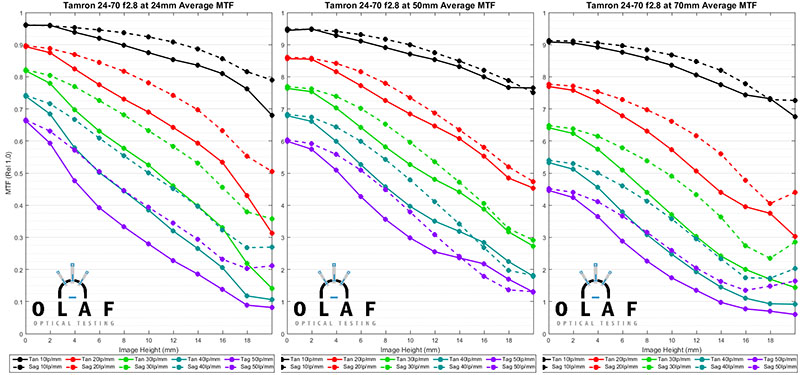
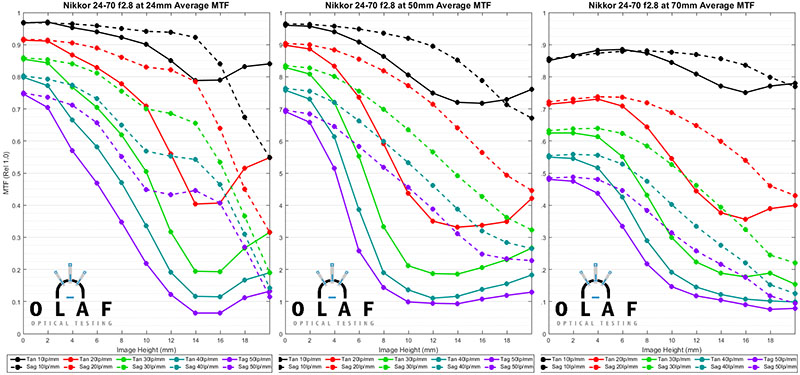
A couple of things should be readily apparent. First, all three of these zooms are weakest at 70mm. For the Canon and Tamron lenses, some things are better at the wide end and some better at 50mm, but overall the Tamron is probably at it’s very best at 50mm. At all focal lengths the Canon is slightly better than the Tamron, but it’s a pretty close match. The Nikon is an older design and it shows. In the center at wider focal lengths, it’s as good as the Canon and right in the center at 50mm it’s the best of all. Off-axis, though, it has more astigmatism than the other lenses. At 70mm it just isn’t as good as the other two, dropping MTF quite a bit more than the other two lenses.
I think the MTF graphs do a lot to illustrate one reason there are so many ‘which lens is better’ arguments on the internet. Someone shooting the Nikon 24-70 at the middle of the zoom range and concentrating on subjects in the center of the lens is going to say they’re lens is awesome. Someone shooting it at 70mm may well think it’s not so great. But another reason for those ‘which lens is better’ arguments is sample variation, so let’s look at the consistency numbers for those same lenses.
Copy-to-Copy Variation
I expected zooms would have more copy-to-copy variation than primes and therefore, lower Consistency numbers. With the prime lenses, we said a consistency number over 7 is excellent, a score from 6-7 good, 5-6 okay, 4-5 is a going to have significant copy-to-copy variation, and under 4 is a total crapshoot. I wasn’t exactly sure what we would see with the zooms.
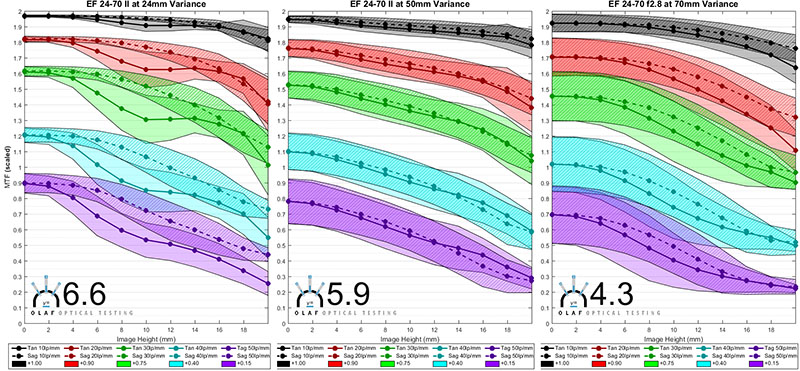
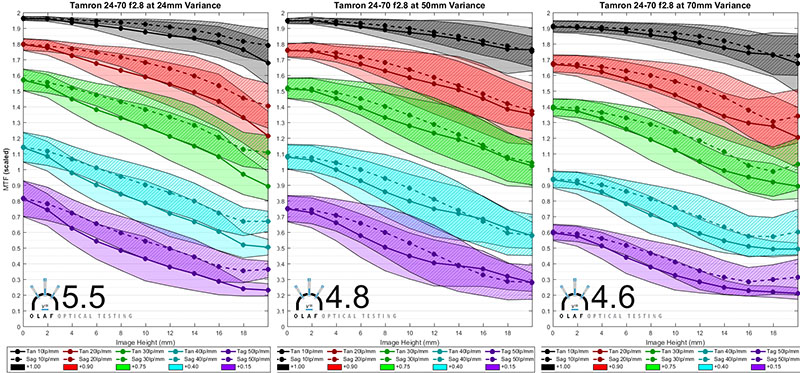
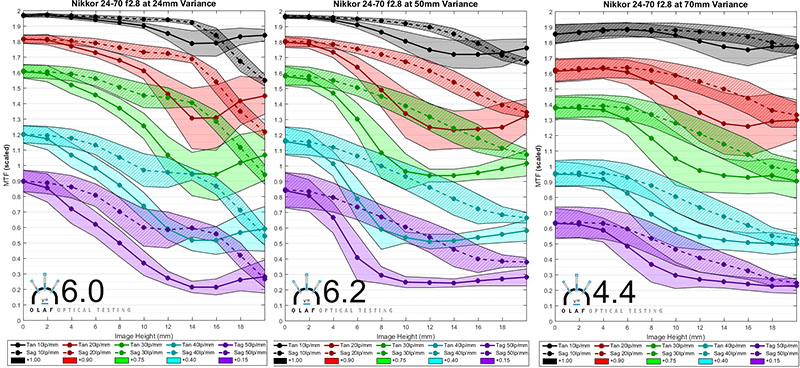
Overall, I’d say things met my expectations. Just looking at the consistency numbers it becomes apparent that there’s more variation at 70mm for all three lenses. There’s practical value in knowing that both variation and resolution are weakest at 70mm. A lot of photographers have other lens options in their bag they might consider when they’re going to be shooting in that 70mm range. I think it’s also worth remembering not to generalize your lens. These 24-70mm zooms, like every other zoom we’ve tested, do NOT perform the same throughout their entire range.
The way in which copy-to-copy variation occurs is also interesting. Notice that the Canon varies as much in the center at 70mm as it does across the rest of the frame. This means the Canon, at 70mm, is varying quite a bit in overall resolution rather than having a soft corner or side. The Tamron tends to have less center variation and more variation as you get away from center.
In general, though, this group of zooms did as well as I would have hoped, and particularly well at the wide end.
A Different Look
I generally present a lot of complex data. I want people to be able to see exactly what we did, how we did it, and show everything we saw; at least within reason. But I do realize that is overwhelming for a lot of people. They don’t want to try to decipher MTF curves. With that in mind, we’re going to start presenting some simpler summary charts. Like most summaries, they’ll be easier to compare. And like most summaries, they’ll leave out a bit of data. But I do think they’ll be helpful for a lot of people.
Below are 2-D MTF curves for the same lenses we tested above. This gives a good idea for how good the resolution is across the entire field of the lens, except the very tip of the corners (our MTF bench doesn’t quite reach there). For each lens, at each focal length, we’re showing 10 line pairs/mm on the left and 30 line pairs/mm on the right. (The rectangle in the center represents and APS-C size sensor.)
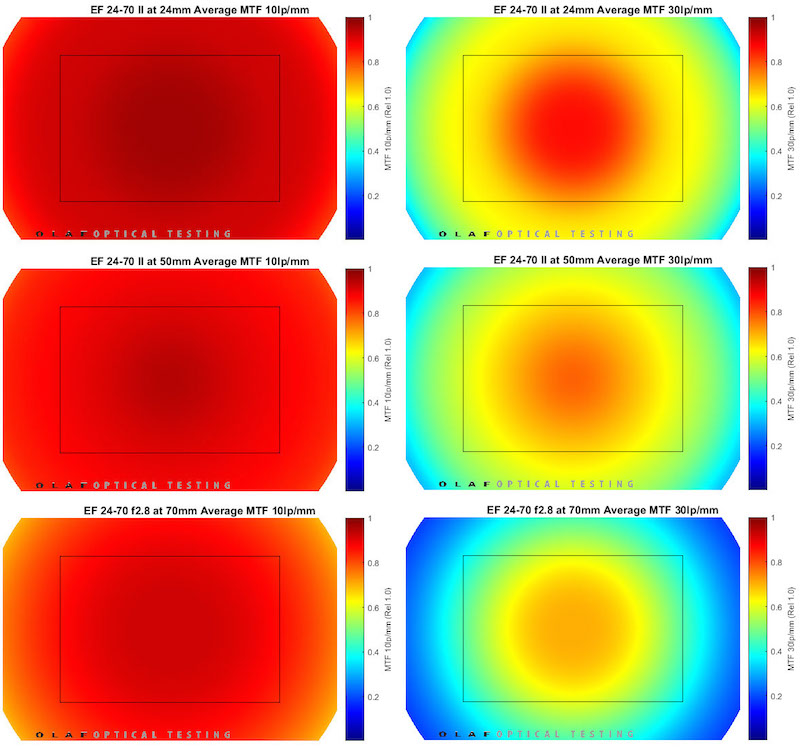
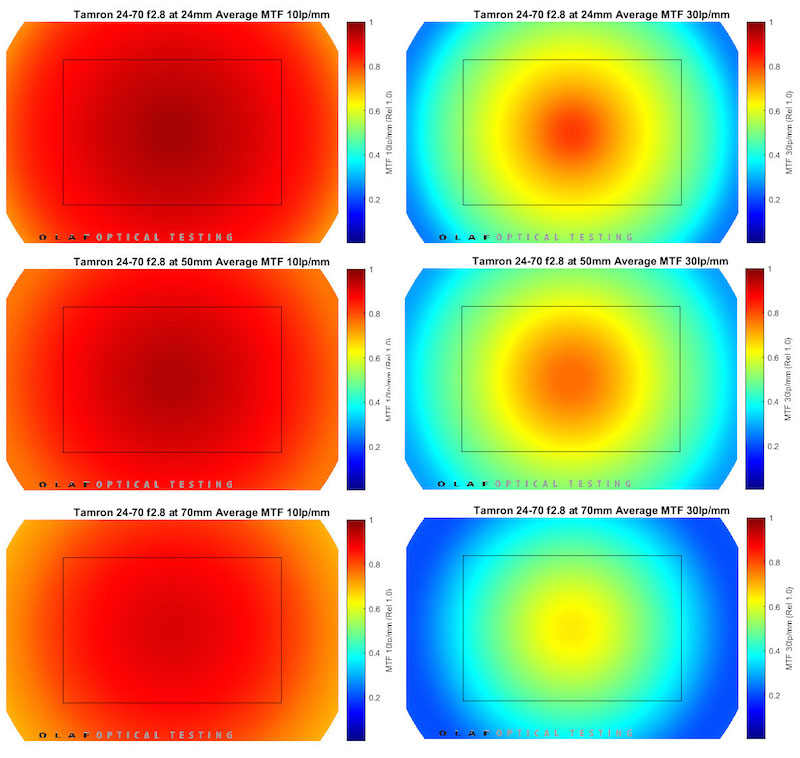
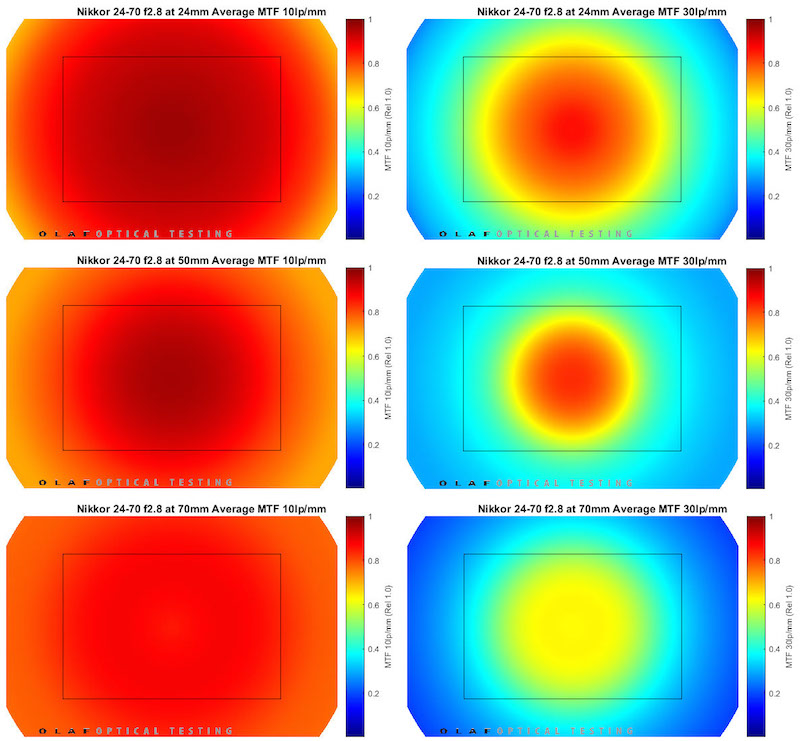
I want to emphasize that while graphs like this are nice, they do leave out a lot of data. For example, these show the average of sagittal and tangential MTF, so you don’t get any information about astigmatism. They only show 10 and 30 line pairs / mm. Still, they are a nice, quick way to roughly compare lenses. We’ll be using them going forward, and The Digital Picture will also be putting them up as an option in their Lens Comparison Tool.
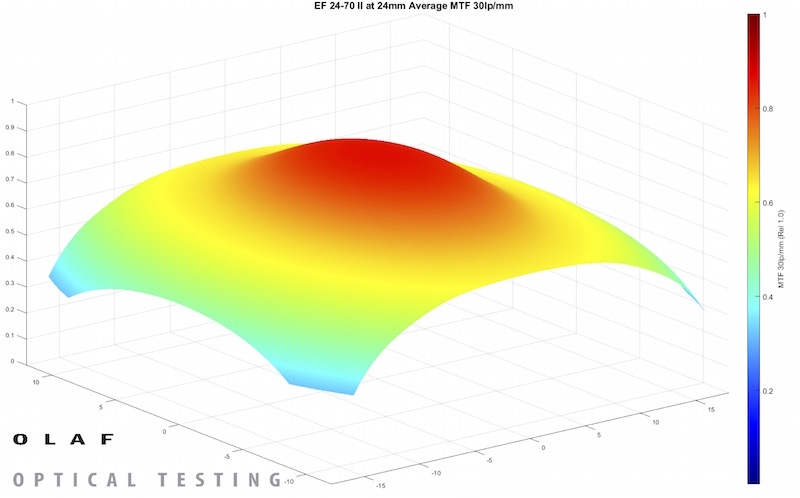
We have also looked at putting this up as 3-D graphs. Below is the Canon 24-70mm at 50mm and 30 line pairs/mm for example. I’m not sure I’ll be using this very often, but it’s pretty so I thought I’d get your input as to whether you like it.
Roger Cicala and Brandon Dube
Lensrentals.com
July, 2015
28 Comments
Tobi ·
The ‘different look’ surf plots indicate information over the entire field of view, but are created from interpolated data recorded at different angular settings. In my opinion, this gives the illusion of increased data and information, which was there, but has been stripped off.
Tobi
LM ·
3D plots are nice, but we would need a 3D display and mouse to properly study them.
I am using a desktop computer so arranging the data horizontally would suit me better. That is for ex. all 24mm results in the same line.
By the way, captions from the MFT pictures are a little small.
A Ronald Gallant ·
Excellent! A tremendous service to the profession. I especially appreciate “A Different Look”: It is much easier for the human mind to grasp than MTF charts. Your co-operation with The Digital Picture is an excellent innovation. Well done!
Ron
Mark Sirota ·
One small comment: “Each lens is tested at both ends of the zoom range and in the center of the zoom range.” The center of the zoom range of a 24-70 is 41mm, not 50mm (sqrt(70/24) * 24 = 41). Obviously this doesn’t invalidate your 50mm results, but one would expect results more similar to the long end than the wide end.
Jeremy ·
Great data of course, if these “showcase” zooms have significant copy-to-copy variation, what would kit lenses have I wonder. This also seems to confirm that for my style of shooting with zooms (always at one extreme or the other) I’m better served by primes. OF course it would also be nice to have some other OEM makers in this range for comparison, but then I know I’m already getting more than I paid for.
John D ·
I don’t know about anybody else but I think all the data to date makes a strong case for using primes instead of zooms. These are some of the best, most common zooms out there and they look pretty good, but not pretty great. Curious to see how the 70-200’s do
Jonathan ·
Any data/justification on why you kept the same sample size as when testing primes? Since you expected greater variation with zoom lenses, it would seem intuitive to test more copies of each lens to ensure a representative sample (with the understanding that time may just have been a practical limiting factor).
Many thanks in advance! I’ve thoroughly enjoyed these posts!
Roger Cicala ·
Jonathan, I don’t disagree with your point at all, it’s simply a workload issue. A zoom takes over 3 times longer to test than a prime. In reality, after we do enough zooms to get an idea about variation I won’t even be testing 10 copies anymore. It’s just too labor intensive.
Tuco ·
Not sure that the 2D views are materially useful viz those from DxO, and of course those guys add the sensors. Your unique strength is the ability to go a lot deeper into a lens, documenting variation, build quality and repairability. Still waiting for the lens checkup service 😉
8one6 ·
Huge fan of what you guys are doing here. Really wonderful that you’re sharing as much data as you are, and being so open about methodology.
One piece of feedback: when you present your 2-D MTF curves, you seem to have chosen the Matlab default “jet” color scheme. (Red to blue “rainbow”.) From a data-visualization standpoint, it is really frowned upon. It has all sorts of not-so-nice properties and very few good properties.
https://www.cs.nmt.edu/~viz/papers/Rogowitz.pdf
https://jakevdp.github.io/blog/2014/10/16/how-bad-is-your-colormap/
http://cresspahl.blogspot.com/2012/03/expanded-control-of-octaves-colormap.html
Since your data is never negative, you would get much more “honest” and more visually appealing graphics using a more naturally ordered colormap.
Brandon ·
8one6,
In R2015a, parula is the default map I believe (it at least is on our install). We actually looked at several of the maps and chose jet based on it having the most “discrete” levels. There are 8 large color transitions (DR-R-O-Y-G-C-B-V) vs about 3 for parula, 4 for hot, or a low contrast continuum in something like grayscale.
Are there any particular colormaps you would like to explore? There is a chance I will be re-writing the image quality map generating function in the near future based on feedback anyway. If you email me at brandondube@gmail.com I can send you some demo files with different maps tomorrow, we certainly are not data visualization experts.
Thank you!
-Brandon
william ·
Thanks for the fascinating information. How much of a difference in MTF would be required to be able to see it in a photo? With your old test methods it used to be about 10%.
Roger Cicala ·
William, it’s not as simple as Imatest results, varying depending upon which frequency you are considering, what camera you were using, what you are doing with the image (print or web), and even the type of photograph. As a very, very general idea, 10 lp /mm data above 0.9 generally ‘looks’ the same and has a lot to do with how contrasty the image appears (and is by far the most important factor when looking at online .jpgs). For 30 lp/mm data, which has a lot to do with resolution on most cameras, anything above 0.5 is generally going to be fine, while below that details start to look fuzzy. With a very high pixel density camera, like the 5D sR, 40 and 50 lp/mm come into play but they aren’t very important on lower megapixel cameras.
Brian ·
I too would prefer swapping the rows and columns for the MTF plots to make it easier to compare lenses at the same focal length. I don’t think it would work for more than 3 columns (lenses) however due to a limitation of your site.
I suggest swapping the colors of the 2D plots so blue is good, red is bad. Or not using the 2D plots as I prefer the greater information of the MTF plots.
The 3D plot doesn’t seem to add any info vs. the 2D plots. It is pretty, so if you could find a way to include more info (add in the variation data to make a kind of translucent layer?), that might make it worth doing.
Somebody ·
Roger & Brandon,
In a previous post either one of you commented that for Canon lenses you had to focus the lens to infinity then remove the lens from the camera because you couldn’t adjust it after it was removed (due to electrical requirements). How do you verify the lens is properly focused at infinity before removing it? It seems like a manual lens you can stare at the pinhole lights to verify proper focus before continuing the readings.
Roger Cicala ·
Somebody, I think you were referring to adjusting the aperture, then replacing the lens on the machine. After that we focus them to infinity and the machine fine tunes the focus. It’s only electromagnetic focusing lenses (Sony E mount and some micro 4/3) that can’t hold infinity focus on the machine.
Oliver ·
You seem to have done a very scientific test of the Zooms, and I am a great admirer of your work, but I really have to question the results of the Nikon 24-70 at 70mm. Maybe it is down to testing it at infinity, but the resolution charts I shoot at portrait distance don’t show the same drop off at 70mm in the centre that you show, and DXO doesn’t either. Also you show a dip in the centre, in previous posts with primes this has been down to field curvature – is there something funky going on at infinity and f2.8 with the Nikon that is distorting your results ?
Brandon ·
Oliver,
There is no rule that states the center must absolutely perform better than all other points in the field. Nikon’s computed charts also show an even stronger dip in the center than our measurements. All of these tests are performed at best center focus, the center will never perform better on any copy at infinity.
The dip in the center in the measurements is under 5%. The best advise I can give is not to nitpick MTF at that level; the sample variation is enormously larger than that, and a difference of 5% is not really visible in images anyway.
In terms of optics, the center will have only spherical aberration and as soon as you start going off axis, coma grows the fastest initially. Spherical + Coma + Vignetting yields a higher performance than spherical alone, which accounts for the higher MTF a bit off axis. Please do not confuse coma for oblique spherical aberration and field curvature, which is what LensTip.com has labeled as coma for many years.
If you would like to see an example of how the aberrations balance that way, feel free to read this article and its companion piece I wrote for photozone.de: http://www.photozone.de/aberrationsTheory
Best regards,
Brandon
Baden Kudrenecky ·
2 points:
1) These 2-D graphs for 30 lp/mm are the ticket! They instantly portray the crucial lens sharpness and falloff, and are very easily compared versus the MTF graphs.
2) I can see there is significant peripheral detail loss on the EF 24-70 II, which you have previously extolled as the epitome of sharpness. As the devil of detail is in the corners, I am looking for some prime lenses for comparison, but your results are all for wide open, which makes a comparison questionable. Is it possible to include or post the best prime lens results at f 1/2.8 to provide an equitable baseline?
thanks,
Baden
Brandon ·
Baden,
I’ll do you one better. Here’s the 24-70L and the 24 canon and sigma primes at f/8. We have no way to accurately stop down the Nikon lenses on the bench, so I can’t provide that. The format’s a bit different since this is a raw measurement, but I haven’t generated the average plots yet.
We’ll be starting with one copy for the stop down data. At one stop from max aperture it is a bit iffy, by two stops and further most copies will look darn near the same. It takes as long to do the stop down as it does 10 copies, and time is of the essence.
24-70 II: https://www.dropbox.com/s/ygv6wup5zfnuwkk/MTF_Averaged.png?dl=0
24L II : https://www.dropbox.com/s/unvcok35ol9g73y/MTF_Averaged.png?dl=0
24 Sigma: https://www.dropbox.com/s/d55fodtv06o4or2/MTF_Averaged.png?dl=0
Rules of thumb: 10lp/mm over 0.9 is very snappy contrast and contributes massively to looking sharp until highly magnified, where the spatial frequency increases until it reaches 30lp/mm (5D3) or 40-50lp/mm (5Ds). At the higher frequencies, look for MTF above 0.5. Astigmatism is less noticeable in images, so I would average the two planes. Do not fret differences of 5% or less, they are quite meaningless (much smaller than the sample variance).
Best regards,
Brandon
Baden Kudrenecky ·
Thanks, Brandon:
The 24 L II link is broken.
Brandon ·
My apologies, Baden.
The database is live and changes considerably every day – today over 1300 files were changed.
Here is a new link for the processed 24L II f/8 result: https://www.dropbox.com/s/dve66l7vyx4s03w/EF%2024mm%20f1.4%20at%20f8_avg_.png?dl=0
It should not move anytime soon.
Pieter kers ·
Just now a new Nikon 24-70 VR has appeared on stage…
Hope you can test this one soon too- it should be better than the old one -especially in the corners-and maybe best. ( if you believe the MTF they have published)
Art ·
Fascinating! Thanks for doing all this work and writing it up. One point of clarification: In my experience, generally red is used for “bad” and blue or green are “good”, but you seem to have reversed that. It is disorienting. DXOmark for example shows global field sharpness at various FL/aperture combinations, and green is best, yellow caution, red is a stinker. That strikes me as more intuitive. Is there any particular reason that you chose red being best, not worst? Can you make the change going forward?
Roger Cicala ·
Art, I just like red. And well, to paraphrase Charles Barkley, DxO is not my role model.
lenscreature ·
I tried a bunch of 24-70 II 2.8 copies.
I saw an awful lot of difference in how the focal plane was tilted. Every single copy had it tilted a different way. It’s really a bit of a menace with this lens. And real world shots will tend to always have a least one corner looking different. That said, it’s so good, that even with all that going on, every copy still did better in the field than every 24-105 tried and generally by a wide margin. But still man is there a LOT of copy variation with focal plane tilt! (The 24-70 f/4 IS has very little of that sort of variation at all, by compoarison, although with that lens, some are worse overall at 50mm and some simply are blurries, evenly, around all edges from out mid-frame and out than other copies). If you went out into nature too and set the focus on the exact same point and tripod, etc. all the same you could easily see that the image from each lens had different parts of the image closest to the center of the plane of DOF in each region. Sometimes it was the entire left side was maybe closer than the right, other times it might be say the lower left was set farther back and the upper right closer in, etc.
At 70mm, stopped down, real world nature shooting, the edge performance didn’t match my 70-300L or even my 70-200 f/4 IS.
OTOH, at 24mm, stopped down, for real world landscape shooting, the edge performance held up pretty well and not so different from a 24 1.4 II stopped down (more distortion though for sure). And this 24-70 II has insane sharpness anywhere near center frame at 24mm. The micro-contrast bite it just gob-smacking. On most copies too. Even on the worst for that it was still really strong. Although very often 1-2 corners or 1 side might focus differently. It’s all but impossible to fine one flat across.
I find the real world performance for landscape stuff is superb to the edge (barring focal plane tilt stuff at times) from 24mm-40mm and then very good from 40mm-60mm and then falls off going to 70mm, especially above 65mm.
Going back to 70mm, now looking at center frame, I did notice some copy variation again. One copy was gob-smacking straight from f/2.8 at 70mm! Just crazily sharp there wide open anywhere near center frame. It got a trace better stopping to f/3.2 and then it was already peaked. Not f/4 or f/5 or anything improved it more. This copy clearly beat my 70-300L at 70mm center frame and utterly wiped my 70mm center frame (now comparing them all at f/4) and yes the ‘lowly’ 70-300L, for most but not all copy to copy comparisons, actually handily beats the fabled 70-200 f/4 IS at 70mm (other than for lateral CA which is definitely worse). That 24-70 II copy at 70mm f/2.8 even took down the 70-200 f/4 IS at f/4 center frame with absolute ease.
Then a bunch of copies were very good there too but not quite so crazy and then one or two were definitely lesser (and they also improved on stopping down to like f/5 to hit peak instead of f/3.2 for the one and f/4 or so for the others. That said, even that worst copy for 70mm center sharpness still took down the 70-200 f/4 IS! And I seem to recall it might have been only a touch off the 70-300L. So even the worst, at 70mm center frame, still did basically as well or better than even other top zooms that hit 70mm and if you get a total primo copy for 70mm wide open performance, it’s just crazy! Probably the best center frame 70mm performance of any zooms lens other than maybe the 70-200 2.8 II?? maybe those are close?
But the edges at 70mm on the 24-70 II didn’t quite hold up for me compared to other good zooms like 70-300L, 70-200 f/4 IS.
And the anywhere at all near center 24mm performance on the 24-70 II is really amazing. Such incredible bite! I’ve seen nothing else that does that other than primes.
And if you get a really top one, the 70mm center performance can be pretty astounding even from f/2.8, although it might take trying 6 copies to get one that is crazy. But most are very solid there and even the worst, while not nearly the match is still solid by other zoom 70mm center frame performance so you can’t go wrong, you just, if unlucky, might not go really well and likely won’t go crazily well.
Also, all the talk about who cares about f/8, any lens does the same there by the wide open shooter snobs, is TOTALLY wrong. I find a LOT of difference between lenses at typical stopped down apertures. A LOT. All lenses are NOT the same at f/7.1-f/10! For instance 24-70 II at 24mm totally blows 24-105 away for detailed landscape work even at f/8, even at f/10. And it even does it for more than details (which, at f/8 still, have noticeably more bite in the center; less smearing at the edges) in that CA of nasty types like longitudinal is different so dark branches and bright clouds doesn’t make giant purple glow as much. IN fact the 24-70 II appears to be all but a true APO design!
Anyway, most copies of 24-70 II do well at 24mm other than focal plane tilt stuff and some do crazily well even at 70mm so long as you are away from the far edges where the performance is merely rather average for a decent zoom.
Mike Thomas ·
Do you get these “simplified” MTF charts fro mthe Trioptics machine or do you post process the data?
Are you measuring 1 line and then just rotating it to get the data or are you really rotating the lens in some increment between the measurements?
Ideally, you might do a full measurement across the format and then rotate the lens 5 to 10 degrees, repeat, etc until you do the full 360 degrees.
This will show the zonal aberration.
Roger Cicala ·
Mike, we process multiple trioptics MTF curves, taken with physically rotating the lens through 4 quadrants, to create the graphs you’re seeing.
every 5 degrees sounds really nice. But every 45 degrees, which we do, is reasonable and time efficient enough to let us do multiple copies of the lens which is the primary purpose of the exercise.