Lenses and Optics
The Limits of Variation
A few people were more than a little amused that I, the ultimate pixel-peeper, wrote an article demonstrating that all lenses and all cameras vary a bit; that you can’t find the ultimately sharpest lens. Each individual copy of a given lens is a little different from the other copies. A single copy will behave a little differently on different cameras. Even on the same camera, autofocus the same shot a dozen times and the results will be slightly different. (Don’t believe that? Put your camera on a tripod, single focus point, aim at a target. Look at the distance scale. Autofocus again. And again. You’ll see the camera is focusing a bit differently each time.) So people started asking me “If there’s variation, then what’s the sense in taking all those measurements?”
There’s plenty of reason for all those measurements. They can be really useful once you stop looking for the exact place a given lens or camera should be and accept that there is range of acceptability. I’m not saying the manufacturer’s repair center stating “lens is within specifications” means it’s acceptable. (It may or may not be on your camera.) I’m saying it can be tested and evaluated to see if it really is acceptable.
In other words, we know that computerized analysis using Imatest or a similar program can show us a measureable difference exists between several lenses. But what does that mean? Can we tell when a difference is just the inevitable minor variation and when it’s a meaningful problem? The answer is yes. The vast majority of the time, anyway.
Determining What is Acceptable
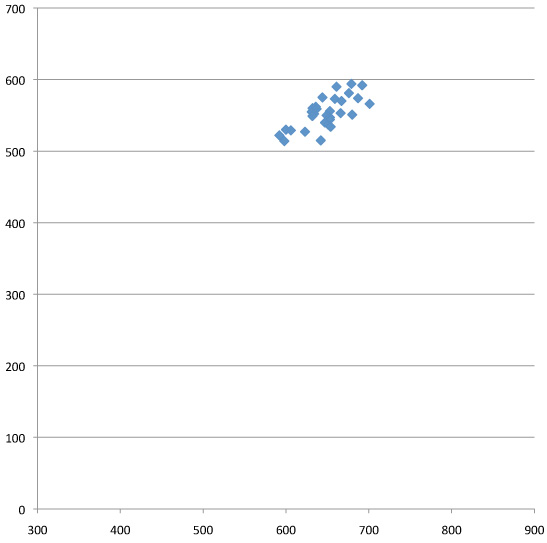
In the last article I used a lot of graphs showing the Imatest results for multiple copies of the same lens, demonstrating how much variation there was between supposedly acceptable copies. I chose to use mostly prime lenses as examples because the patterns were nicely grouped and the outliers were obvious at a glance. Here’s a group of Canon 35mm f/1.4 lenses, for example, and there don’t appear to be any bad copies. It’s a nice, reasonably tight group of results. And knowing how other lenses look when they’re bad, I’d expect a bad lens to be hanging out down around the 500/300 area, well away from this group.
So, the obvious assumption is these are all good lenses. But lets pretend I’m an OCD pixel peeper who’s paranoid that those two lenses at the lower left, the lowest scores of the group, might not be OK. Just because Roger says the group looks good doesn’t mean it is.
Luckily there is a way to help confirm that our grouping is acceptable. Subjective Quality Factor is a measurement developed by Ed Granger and K.N. Cupery in the 1970s for Kodak and used by Popular Photographer for their lens reviews. Basically, SQF uses a mathematical formula, taking the MTF data from the lens (which we get from these tests) to predict with good accuracy how sharp a print would be perceived at various sizes and distances.
I’m not going into detail about SQF (for a more thorough discussion, see Bob Atkins excellent article or the references below). The important part is that several experts have shown an SQF difference of less than 5 for a reasonably sized print is basically not detectable by human vision.
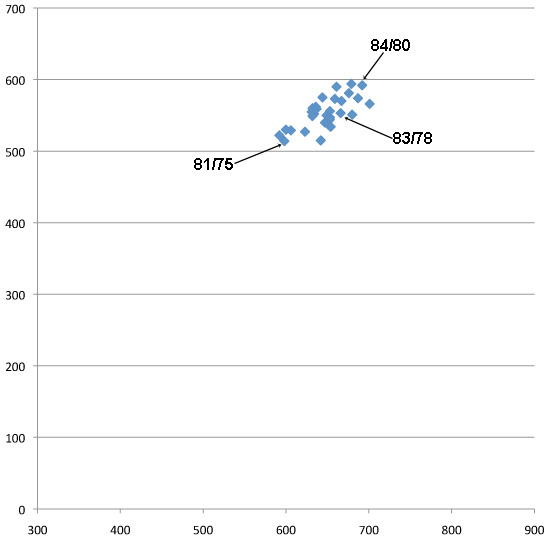
In the graph below I’ve added the SQF numbers for several of the lenses (we arbitrarily use SQF for 30cm height images) for both best and average resolution of the lenses. We could use a different image size and the absolute numbers would change, but not the difference between them (for reasonable image sizes).
As you can see, the highest SQF (84/80) and the lowest (81/75) remain within 5 points of each other. Trying to pick the best lens out of this group (not even considering each will be slightly different on a different camera, slightly different every time it focuses on the same scene, etc.) is basically foolish: we can measure this small difference with the computer, but we couldn’t see it in the picture. However, any lens that tested much lower or to the left of our scattered pattern of good lenses would indeed be softer and you could tell it in a print.
And What Isn’t Acceptable
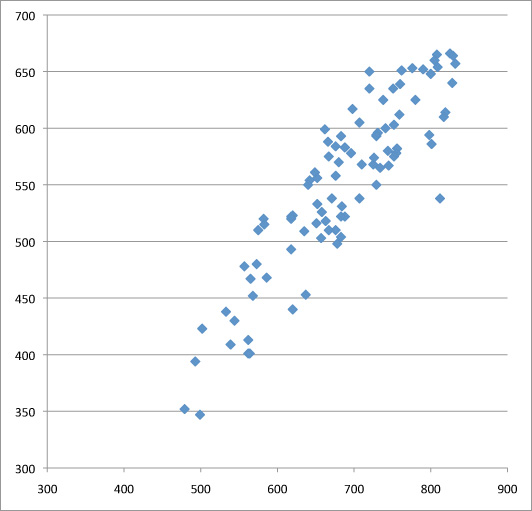
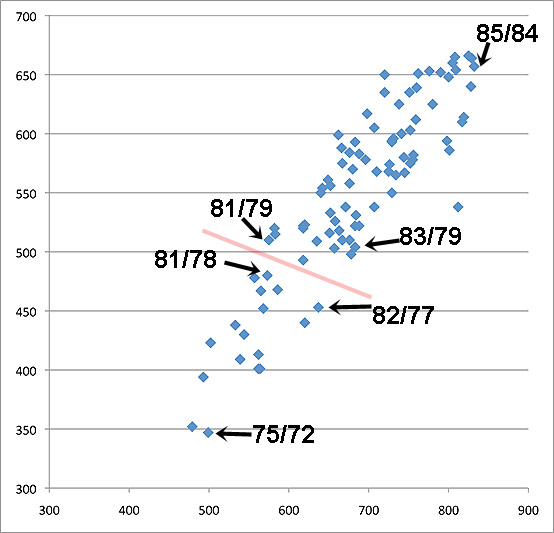
Unfortunately (for my sanity), all lenses aren’t primes with nice tight test patterns that make great examples. Below is a run of almost 100 copies of the Canon 24-70 f2.8 zoom lens tested at 70mm. Why so many? Because when I first tested two dozen copies they were a random smattering of results scattered around the chart. Data doesn’t make any sense? Get more data. Luckily we have a lot of lenses.
But more data didn’t solve the problem either, it just gave me a big smattering of lens results. Zoom lenses do tend to have a bigger copy-to-copy variation spread than primes do, but this was ridiculous. Obviously the two lenses at the bottom left are bad and simple optical testing confirmed that. But what about the group of a half dozen just above the two bad ones? And that other group of a half dozen above those but still under 500 LP/PH? Optical testing wasn’t very helpful, they seemed OK shooting test charts. On the other hand, they didn’t look really sharp either.
SQF was really quite helpful in this situation. Let’s look at the same graph with some SQF numbers added. The very best result we got was an SQF of 85/84. If anything greater than a 5 point SQF would be visibly different, then we can draw a line between the lowest acceptable results and the highest unacceptable results, which I’ve done on the graph.
The truth is, in looking at the graph, that’s where I suspected the line would be — results above that line are fairly tightly grouped, those below it more scattered about. But I’ll admit I was hoping I was wrong, because being right meant we were going to send a whole lot of lenses in for factory service. I believed the SQF data, though, so the whole bunch went off to Canon.
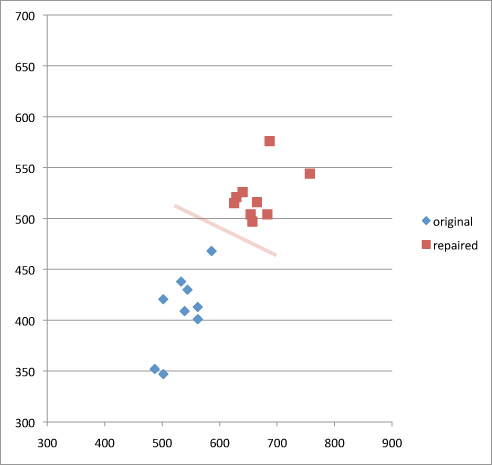
But the proof is in the pudding. Nine of those lenses have come back from Canon. Below are the original test result in blue and the post-repair result in red for those nine copies. I’ve also left in the line from the previous graph that SQF said would be the acceptable cut-off for this lens at 70mm. Not all of them are back yet, but I think these 9 lenses make the point pretty clearly.
As you can see, all of the lenses that were unacceptable by the SQF definition came back from repair in the acceptable range. So it does appears that a bit of pixel-peeping measurement, along with some mathematical calculations, really can give us a reasonable indication of what is just normal variation and what is a bad lens. (BTW, out of all the different Canon lenses, this the only one for which the bad lenses were not completely obvious at a glance. And even the bad lenses from this set all were perfectly fine at less than 55mm, they only had trouble at the long end.)
Of course, now you should be thinking “Roger, why would they just be having trouble at the long end?” and “Why were there so many bad copies of this one lens?” Well, you know me, I have major OCD and I just had to try to figure that out.
The 24-70 mystery
This part has little to do with optical testing, it’s about the Canon 24-70 lens specifically. And before I go further, please raise your right hand and repeat after me: “I do solemnly swear not to be an obnoxious fanboy and quote this article out of context for Canon-bashing purposes.” Because trust me on this: Canon faired very, very well in our testing, with only this one lens being an outlier. Other brands definitely are not better. This one got to be the example simply because we started testing Canon lenses first, and because we have more copies of them.
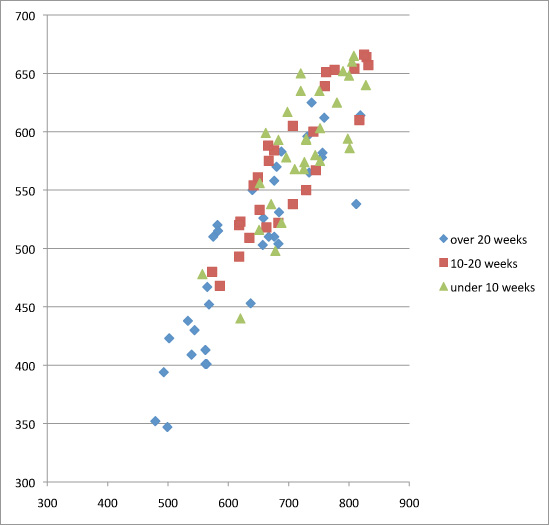
I mentioned in my last post that we found no lenses that got worse with age except “one zoom that doesn’t seem to be aging well” and this is the one I was talking about. Years ago when we started Lensrentals, I arbitrarily decided to sell every lens at two years old. I didn’t have a particular reason for 2 years rather than 1 or 3, it just seemed about right. But since I’d just made that call on my gut, one of the things we have looked at with every lens test was the age of copies tested versus their test results, to see if my assumption was correct.
For lens after lens there was no difference with age, so I was shocked when I looked at the results of the 24-70s. The vast majority of the bad lenses (and all of the really bad lenses) had over 20 rental weeks of use.
All of our lenses rent with the same frequency. All of them get the same care. So what was different about 24-70s that made them have problems with aging when the other lenses didn’t? There is one thing that is somewhat different about 24-70 f2.8 zooms: they are both barrel extending (rather than internal) zooms and are rather heavy. Most barrel extending zooms are lighter. Maybe thousands of zoom twists was wearing something out.
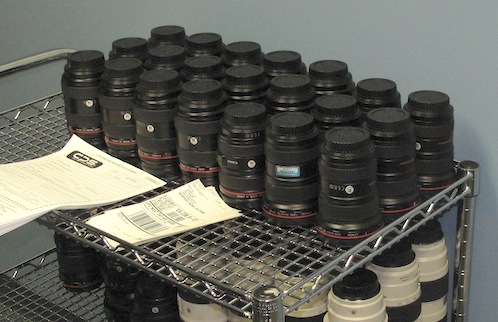
Well, we might not be capable of repairing most lenses without the factory repair center to help, but we certainly are capable of taking them apart (especially when we know they have to go in to be fixed anyway, we’re real brave then) and looking around. What we found was rather interesting. In the zoom helicoid are several screws with plastic collars around them that keep the barrel tracking properly within it’s grooves:
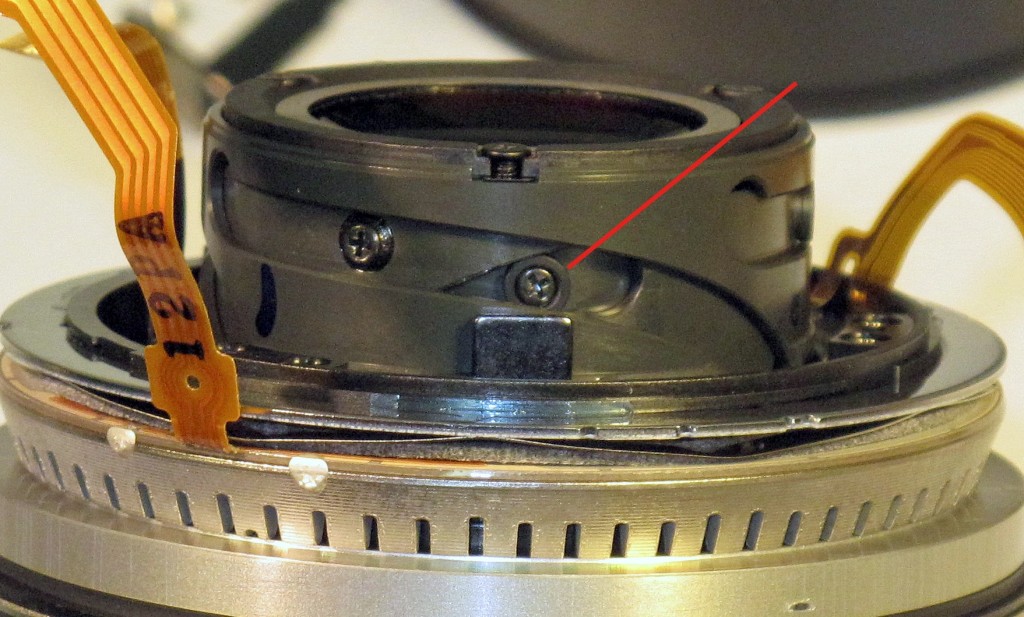
The plastic collar (red arrow) around the screw keeps the lens tracking properly in the helicoid groove.
There are a number of such screw/collar assemblies in the lens. When we looked at some of the bad lenses, we saw several screws that seemed to be missing their collars. In several of the lenses, like the one shown below, we found the collar broken off and loose inside the lens.

Forceps being used to remove a collar that had come loose and wedged between sleeves of the lens barrel.
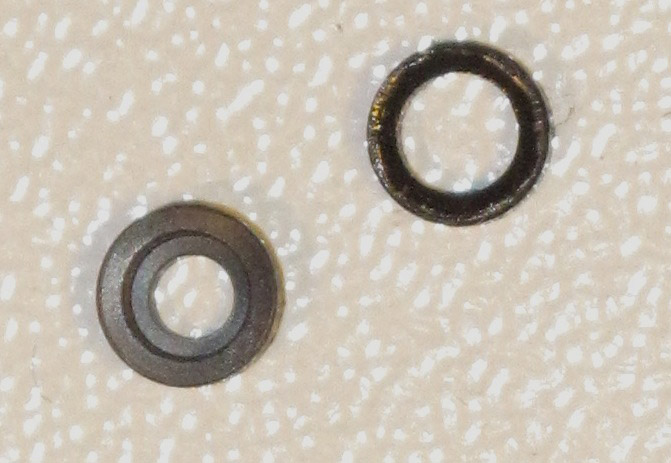
When you compare a fresh new collar with one we fished out of an older lens, it becomes pretty apparent they’ve worn down and eventually broken off from around the screw. We didn’t find missing collars in every bad copy we opened, but we did in most of them.
A missing collar or two could (I assume – I don’t know for certain) allow the internal barrel to not stay properly aligned as it tracks in and out with zooming. If it wasn’t properly aligned, it wouldn’t focus properly. Perhaps that explains why these lenses usually have trouble at 70mm and not throughout the entire range. Why 70mm and not 24mm? I have no idea. We did see a couple of lenses with problems at the wide end (and they were both sharp at 70mm), but not nearly as many and they were very clearly outliers.
Before you freak out about your personal 24-70, though, remember these are rental lenses. Probably every one gets more use in a year than yours does in a lifetime.
The Bigger Picture
For those of you into pixel peeping and “I demand a perfect copy” kind of stuff, I think this is the takeaway message:
Copy-to-copy variation is real, although barely detectable in actual photography. If you pixel peep you can find a difference that’s real, but not significant. Meaning you can see a small difference in test results, but couldn’t tell the difference in a print.
Bad lenses are usually massive outliers, easily detected at a glance (see the previous article for examples) or with the most rudimentary testing (like just taking some pictures) in the majority of cases.
There are some situations, like our Canon 24-70s, where a measured difference isn’t huge (at least compared to really bad lenses) but probably is significant enough to affect the sharpness of a print. While SQF isn’t the be-all, end-all measurement and has very real limitations, it can be a useful tool helping us to decide what is, and is not significant.
Finally, for those of you (and there are a couple of million of you) who own a Canon 24-70, please don’t go off the deep end because of this demonstration. Remember, these are rental lenses. They get used heavily an average of 90 days a year (and probably not as gently as you would use your own equipment). Plus they are shipped all over the country, an average of 20 round-trips a year. As I’ve always said, Lensrentals.com should be considered battle testing for photo equipment. Whatever can fail, will fail here. It doesn’t mean your copy is going to do this.
But if you have an older copy, and you feel it’s softer at 70mm than in the middle and short ranges, it probably is worth a trip to Canon for a checkup. It should be obvious from the graph above that it can be fixed quite effectively.
References:
Biedermann and Feng: “Lens performance assessment by image quality criteria” in Image Quality: An Overview, Proc. SPIE Vol. 549, pp36-43 (1985)
Granger and Cupery: “An optical merit function (SQF) which correlates with subjective image judgments.” Photographic Science and Engineering, Vol. 16, no. 3, May-June 1973, pp. 221-230.
Hultgren, “Subjective quality factor revisited: a unification of objective sharpness measures”, Proc. SPIE 1249, 12 (1990)
An Addendum for Lensrentals Customers:
About two dozen people have bought Canon 24-70 lenses from our used lens sales page over the last year. Obviously the inspection we carried out when you bought the lens did not include the Imatest information we now obtain on the lens. If any of you have doubts about the sharpness of your lens at 70mm, we would be happy to test it for you. Please send us an email before you send us the lens, though, so we won’t wonder why a lens arrived in the day’s shipments that doesn’t register in our inventory.
Roger Cicala
Lensrentals.com
October, 2011
Author: Roger Cicala
I’m Roger and I am the founder of Lensrentals.com. Hailed as one of the optic nerds here, I enjoy shooting collimated light through 30X microscope objectives in my spare time. When I do take real pictures I like using something different: a Medium format, or Pentax K1, or a Sony RX1R.

Pingback: Lens Variation Article on LensRentals.com - Micro Four Thirds User Forum()
Pingback: 14mm f2.5 vs 14-45mm f3.5-5.6 - Page 3 - Micro Four Thirds User Forum()