Seeing the Numbers
When someone tells you that something defies description, you can be pretty sure he’s going to have a go at it anyway. – Author Unknown
A lot of my posts about lens resolution consist largely of showing the MTF 50 numbers from Imatest or our optical bench. That leads to a lot of questions about what that numerical difference really means, and how much you would notice it in photographs.
My usual response to that has been more numbers: SQF data that shows how large of a print would be required for you to see the difference at close viewing angles. But photographers are visual people and more numbers don’t always seem to answer the question. So I thought we’d try to show what a difference in MTF 50 numbers really looks like.
This is harder than you might think. I’m trying to use your monitor, at 72 dots per inch but with a huge color gamut, to demonstrate the difference you would see in a print at 300 dots per inch but with a smaller color gamut. The most accurate way to do it would be to invite you all over to look at some prints, but that’s not practical.
Today’s Testing
We’ll try something I think will usefully demonstrate what the numbers say and what you can see.
1) I’ll test specific copies of several lenses and give you their MTF50 measured by Imatest.
2) I’ll shoot testing-quality images (measured square, tripod mount, remote release, focus bracketed).
We’ll use ISO 12233 charts with the same lenses and show you 100% crops. It’s certainly the most used, and probably the most sensitive, of the optical charts for testing resolution. This should demonstrate what kind of difference a thorough home tester could see.
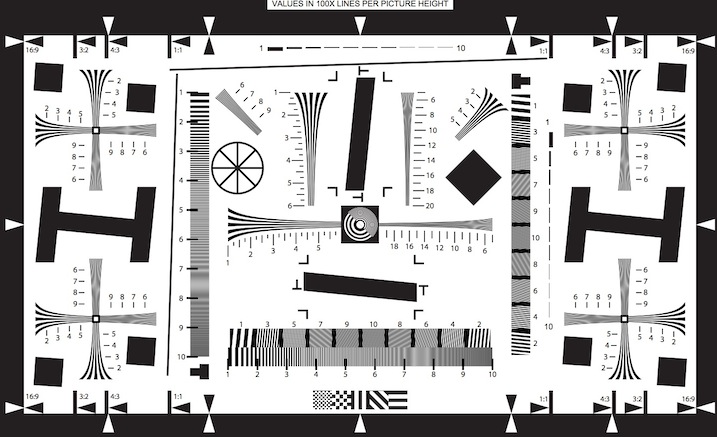
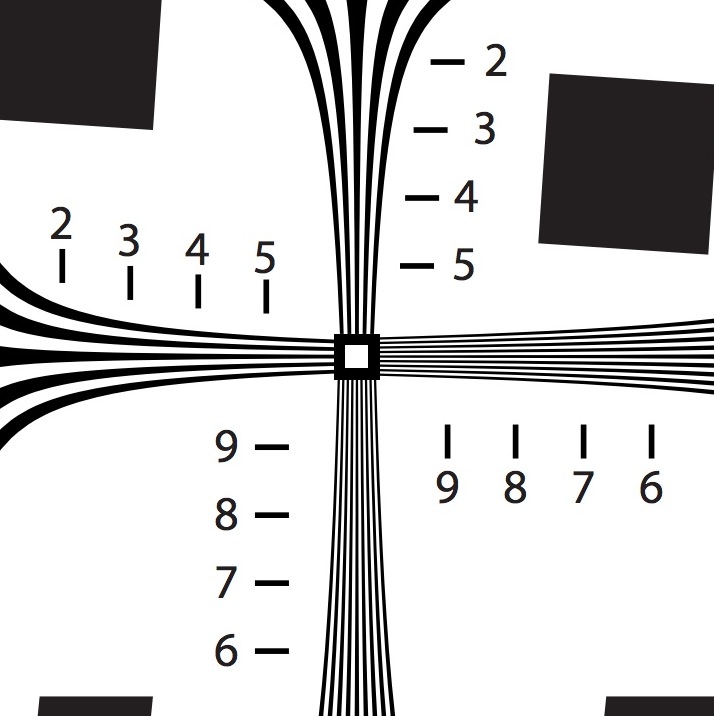
Its best feature for our purposes are the 4 crossed resolution charts in each corner, which demonstrate off-axis astigmatism pretty well (horizontal and vertical resolution are obviously different when there’s astigmatism) and let us compare the 4 outer quadrants of the lens.
3) Finally, I’ll send the raw files of some routine photographs taken with the same lenses and camera over to Uwe Steinmueller at Digital Outback Photo. Uwe is an expert post-processor, far better than I, and we’ll see how much difference there is when he’s completed his workflow. (To keep this of reasonable length, Uwe’s article is posted separately HERE.)
One nice side bar: one of the lenses has a slightly soft corner as measured by Imatest, but it’s not obviously decentered. So it will be interesting to see if we can actually detect it outside of Imatest measurebating. I’m guessing not, but I haven’t looked yet, I’m just putting my vote up before I complete the article.
Meet Today’s Contestants
I’m going to play with some Nikon-mount lenses today, mostly because that lets me use the Nikon D800‘s sensor to generate the best resolution we can. We’re going to compare some 35mm lenses: The Sigma 35mm f/1.4; Nikon 35mm f/1.4 G; Nikon 16-35mm f/4 VR at 35mm; and the Nikon 24-120 f/4 VR at 35mm.
Why did I choose these? Well, I’ll tell you.
- The Sigma 35mm f/1.4 is the highest resolving 35mm prime I’ve ever tested.
- The Nikon 35mm f/1.4 G is designed another way with emphasis on things other than wide-open resolution.
- The Nikon 16-35mm f/4 VR is an excellent optic, but is weakest at 35mm where we’ll be testing.
- The Nikon 24-120mm f/4 VR is another excellent optic, and is at its strongest around 35mm-70mm.
Why did I not choose the Nikon 35mm f/1.8, Zeiss 35mm f/1.4, Rokinon 35mm f/1.4, Schneider Cine-Xenar 35mm, or whatever else you’re going to tell me you wanted to see? Because this isn’t a 35mm lens test. It’s an attempt to use some lenses that I know will generate different MTF 50 charts to see how easily you can actually see (or not see) the difference between them.
I tested one sample of each lens, but, of course, chose them from sets that had been recently lab-tested to be certain they were all reasonably good copies. Even then, I tested a second Nikon 16-35 and Nikon 35mm f/1.4, because fanboys love to scream ‘bad copy’ when their favorite lens doesn’t do quite as well as the others. The second copies were no different, and again, they were selected because they were known to be at least average from a pool of 50 copies.
Let’s Test Some Lenses
First I’ll start with a table showing peak center, weighted average, and average near-corner resolution for each lens. The numbers are MTF 50 in line pairs / image height. I should mention these are not my usual average of 50 copies; these are the specific results for one copy of each lens used in this test. (Each copy was, of course, pretested to make certain it was a good copy compared to our database of known values for each lens.)
| Lens | Aperture | Ctr | Lens Avg | Corner Avg |
|---|---|---|---|---|
| Nikon 16-35mm | f/4 | 946 | 715 | 400 |
| Nikon 16-35mm | f/5.6 | 969 | 781 | 460 |
| Sigma 35mm | f/1.4 | 973 | 778 | 480 |
| Sigma 35mm | f/2.8 | 1171 | 961 | 575 |
| Sigma 35mm | f/4 | 1218 | 1016 | 800 |
| Sigma 35mm | f/5.6 | 1160 | 1025 | 825 |
| Nikon 35mm | f/1.4 | 740 | 607 | 425 |
| Nikon 35mm | f/2.8 | 1020 | 830 | 590 |
| Nikon 35mm | f/4 | 1065 | 945 | 775 |
| Nikon 35mm | f/5.6 | 1135 | 985 | 840 |
| Nikon 24-120mm | f/4 | 1100 | 883 | 460 |
| Nikon 24-120mm | f5.6 | 1100 | 930 | 560 |
The numbers run together a bit in a large table, so let me summarize a few points:
- Except for the Nikon 35mm f/1.4, all of the lenses are maximally sharp in the center by f/4. The Nikon lenses all sharpen their corners further at f/5.6 compared to f/4,but the Sigma doesn’t, at least not significantly. (See — numbers do have some value for real-world photography.)
- At f/1.4 the Sigma has significantly higher resolution than the Nikon 35mm f/1.4. It’s still a bit higher at f/4 (although I’m not sure that slight difference is significant), and they’re about even at f/5.6.
- The 24-120mm seems to outperform the 16-35mm at 35mm (not shocking, as I mentioned the 16-35 gets a bit weaker right at 35mm).
- At f/4 and f/5.6, the prime lenses are better in the corners than the zooms, but not much different in the center.
It might be simpler to look at one of the charts I generally use for presenting Imatest data. The center MTF 50 is on the horizontal axis, weighted average MTF 50 on the vertical, both in Line Pairs / Image Height. To keep it somewhat simpler I’ve just plotted f/4 (square) and f/5.6 (diamond) data for each lens.
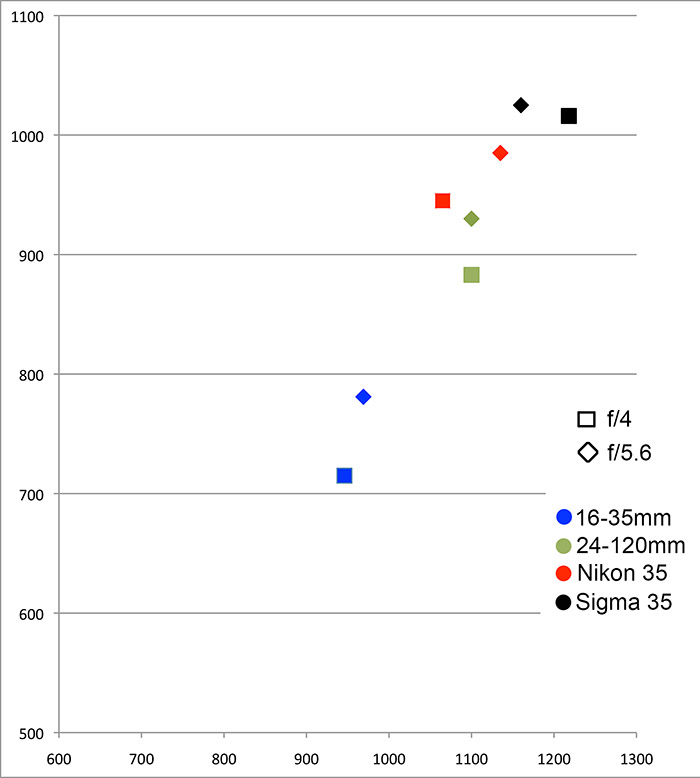
Just looking at center resolution (horizontal axis), I’m fairly certain that at f/4 (squares) I could see a difference between the 16-35 and the Sigma 35mm, but could not see a difference between the Nikon 35mm and the Nikon 24-120mm. I’m not so certain that I could see a difference between the Sigma 35mm and those two Nikon lenses, but think I probably could.
Center Resolution Reality Check
Before I put up more test chart examples, let me graph just center resolution for all of the lenses to simplify things a bit. As always, I know some fanboys are going to spit biscuits about how sharp their Nikon 35mm f/1.4 is wide open. This is a good copy, right at average in test results of the 50+ copies we have in stock. At f/2.8 it’s resolving very well indeed, and its edges and corners are excellent, but it’s not designed to win center resolution championships wide open.
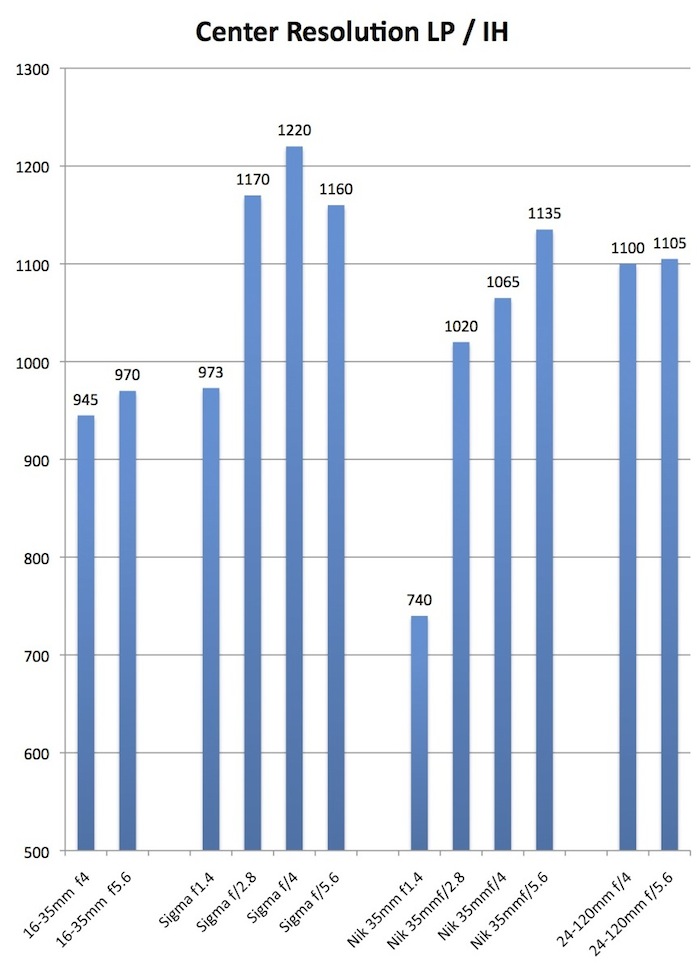
So let’s look at images of the ISO 12233 chart shots of the lenses shot at f/4. The worst resolves at 945 lp / ih (and worst isn’t a good term, that’s still very, very good resolution). The best resolves at 1220 lp / ih, and the other two just over 1100. Can we see the difference in a test chart shot? Here are 100% crops — to save a little bandwidth I didn’t include the Nikon 35mm f/1.4 image – it’s indistinguishable from the 24-120mm. PLEASE NOTE – the Sigma lens was shot at f/4, just like the other two lenses in this example.
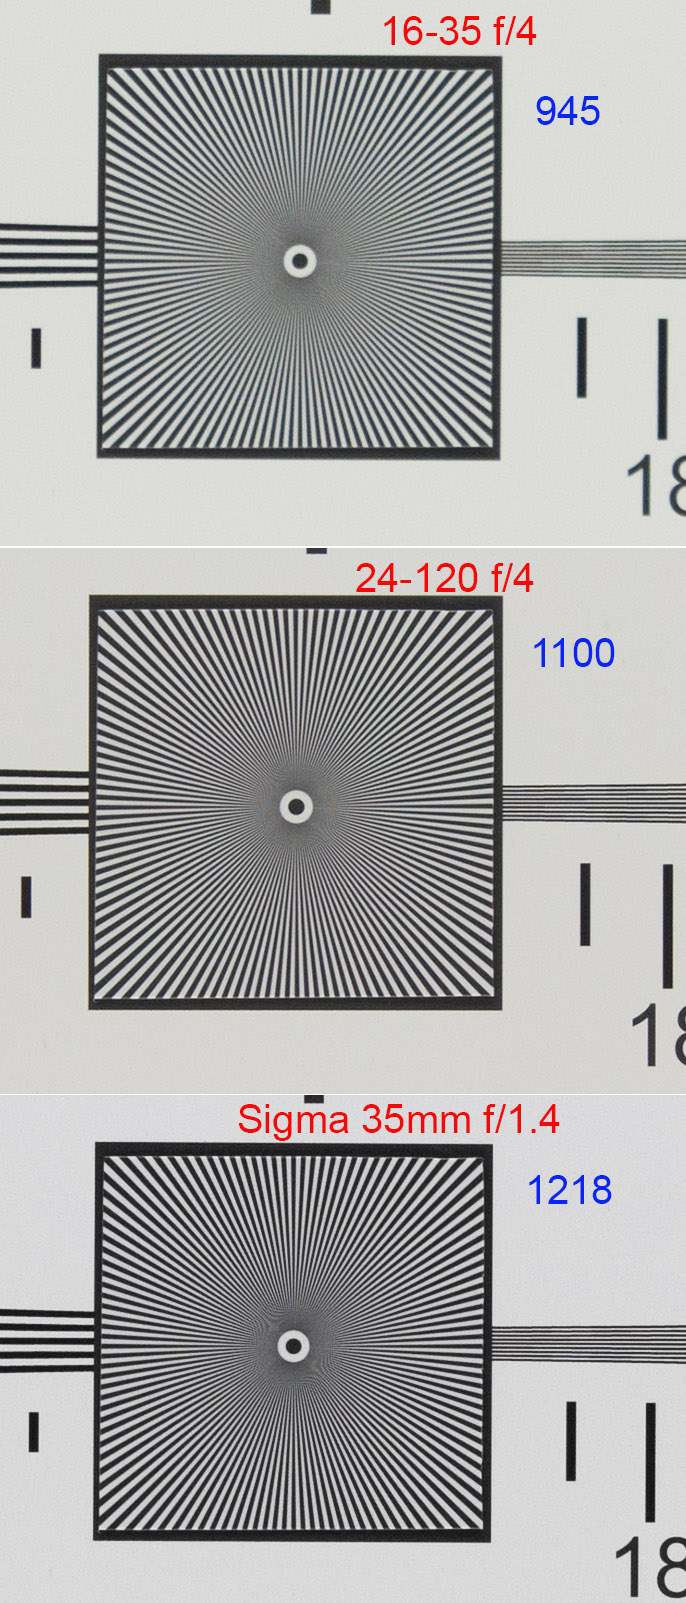
I think this shows pretty well that different numbers (if they’re sufficiently different), are something you can detect with a bit of pixel peeping. But it’s not glaringly obvious.
One thing I suggest you do right now: downsize the image to 50% instead of 100% (which most people suggest as a more reasonable approximation for viewing an actual print). You can probably still see the difference. Now downsize it to 12.5% (about online jpg size). Can you see the difference now? If you can, you need a medication increase.
Now, here are three more center ISO 1223 charts. Before I tell you what they are, see if you can rank them from highest to lowest resolution.
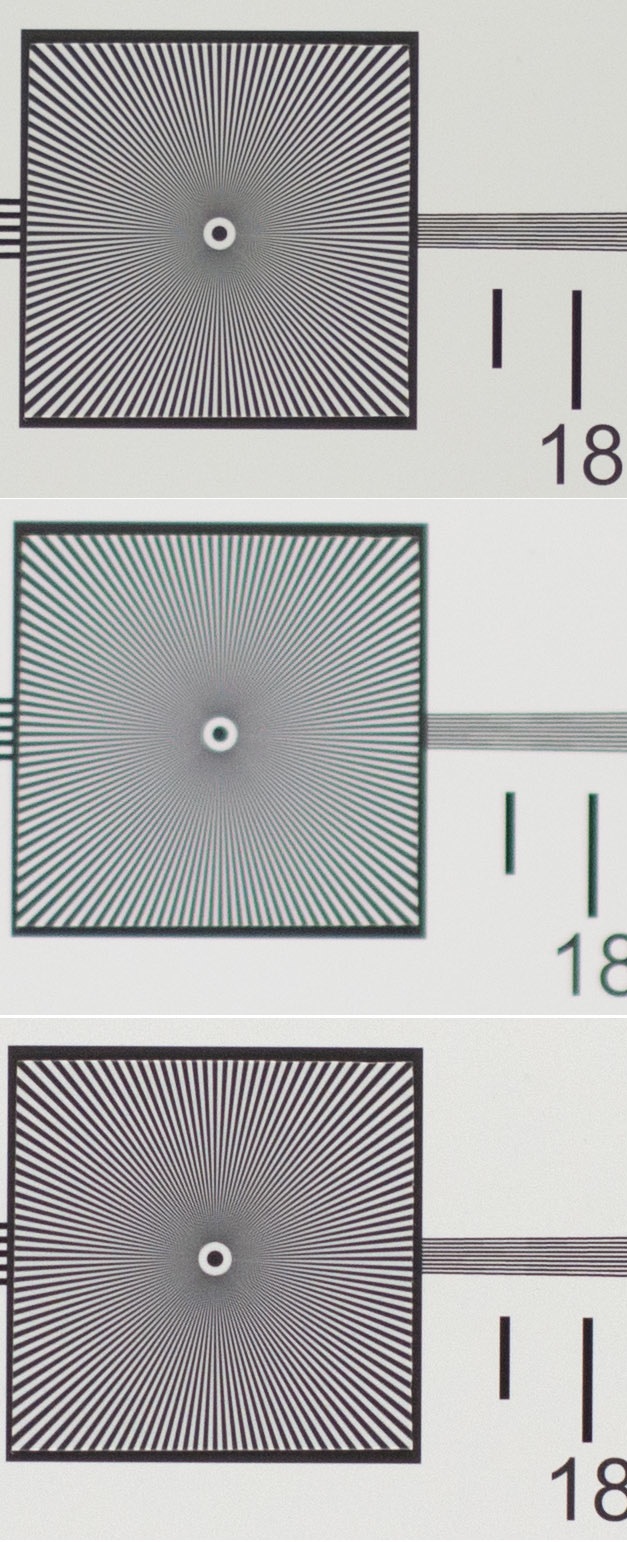
If you said the bottom image is just a bit sharper than the top image, you’ve got good eyes. It is, but just a bit. Both are clearly better than the center image, though, aren’t they?
From top to bottom the crops are: Sigma 35mm at f/1.4 (973 lp/ih), Nikon 35mm at f/1.4 (740 lp/ih), and Nikon 35mm at f/4 (1065 lp / ih). If you go back to the blue bar graph and look at the numbers, we’re comparing the lowest resolution to a couple of the mid resolution lenses. You can scroll back up and compare these to the others.
So what is my summary at this point? A difference of roughly 20% in MTF 50 in the center of the lens is readily visible in test charts. A difference of 10% is visible but you have to really look closely to see it. When it gets down to someone saying “this lens at 950 line pairs / image height MTF 50 is better than that lens at 900 lp/ih – well, that’s getting silly.
How About a Few Corners?
You might want to scroll back up and look at the computer generated ISO 12233 corner image, just to refresh yourself about what ‘perfect’ would be. With real lenses, we don’t often get close to perfect in the corners. This section will also answer a question I get asked fairly frequently — why don’t I post corner numbers and instead use average lens numbers? The answer is because corners are about a lot more than MTF 50.
Just to refresh, all of our lenses have corner resolution from 400 line pairs / image height wide open. The Sigma and Nikon 35mm f/1.4 both give near-corner resolution over 800 lp / ih when stopped down. At f/5.6 the 16-35mm and 24-120mm have resolutions of 460 and 560 respectively. So what does that look like? Here are lower left corner images from ISO 12233 shots for a representative sample, and I put the MTF 50 numbers in blue on each sample so you don’t have to look back and forth.
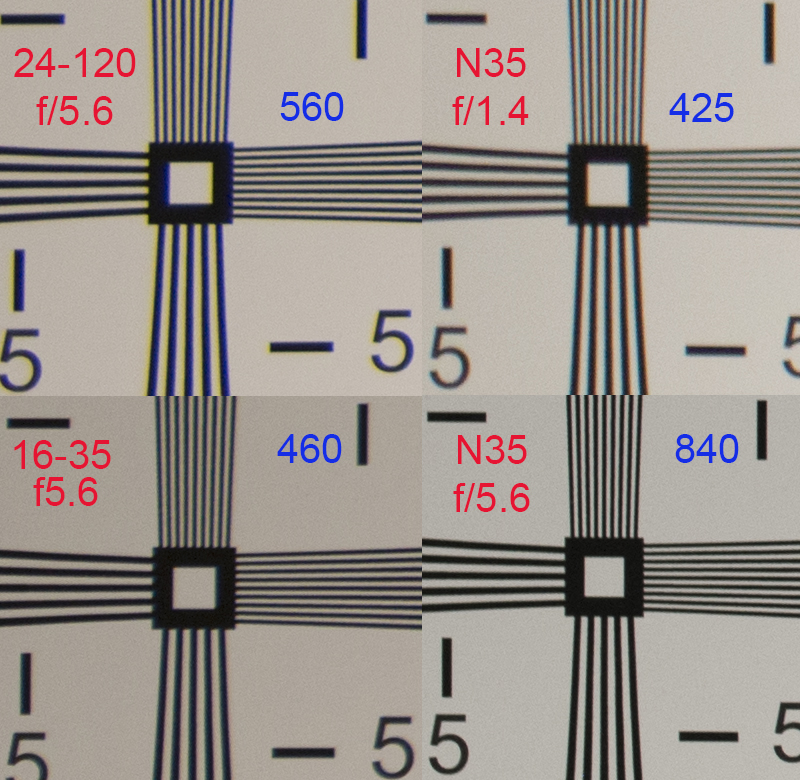
Let’s talk about the real things first, before the ‘gotcha’. I think you can all tell the Nikon 35 at f/5.6 is a bit sharper than the two zooms. My eyes don’t think it’s twice as sharp, which the MTF 50 numbers sort of insinuate it is. I think I can tell the difference between the two zooms, pixel-peeping with this 100% crop. At least I think I can. But it’s a lot closer than I would have expected given the 100 point difference in MTF 50.
But I know what you’re thinking, “What’s up with the 35mm at f/1.4 looking so soft?” If we can hardly tell the difference in the two zooms, shouldn’t the 35mm look about the same as the 16-35 at least?
Well here’s a great example of MTF numbers not telling the whole story. The Nikon 35mm f/1.4G has both longitudinal and lateral chromatic aberration in the corners wide open (look along the edges of the thick square where the lines join it, or the edges of the “5”s). The two f/4 lenses, because they’re f/4, don’t really have these issues so they look better, even though the MTF numbers are roughly the same.
There are other things that affect corners a lot in addition to MTF numbers: coma and other aberrations, distortion (you can fix it in post, but you’ll loose some resolution doing so), vignetting, etc. And finally, I should mention the ISO 12233 chart isn’t quite the corners, although it’s fairly close.
So what is my summary about corners? Well, a big MTF difference is a good thing. Like the numbers suggest, the Nikon 35mm prime at f/5.6 is clearly better than either of the zooms. But in the outer parts of the image, MTF is not the only thing, not by a long shot. A smaller MTF difference, even a 20% (100 lp / ih) difference, may not be a good indicator of which lens has better corners.
There is another 20% difference in MTF corners, though, that I want to look at. What if the difference is between corners on the same lens? In that case the corners, in theory at least, should have the same vignetting, aberrations, etc.
Demonstrating a Problem
Imatest gives us a lot more numbers than the averages I put in the graphs and that gives us an opportunity for another nice example. The Sigma 35mm f/1.4 we used for this test has an upper left (image) corner that’s a bit softer than the others as shown in the more complete Imatest printout below. (Notice the horizontal / vertical resolutions of 399 / 365 compared to around 500 in the other corners). It’s also a bit softer in the right lower (image) midrange than the other midranges. In other words, it’s very slightly decentered.

The question is whether this slight degree of decentering is really visible? (Trust me, this is slight. A really decentered lens would have areas of resolution under 200 lp/ih and much more astigmatism.) Checking SQF numbers tells me the difference should not be visible in an 8 x 11 print. But is it visible with a bit of pixel peeping?
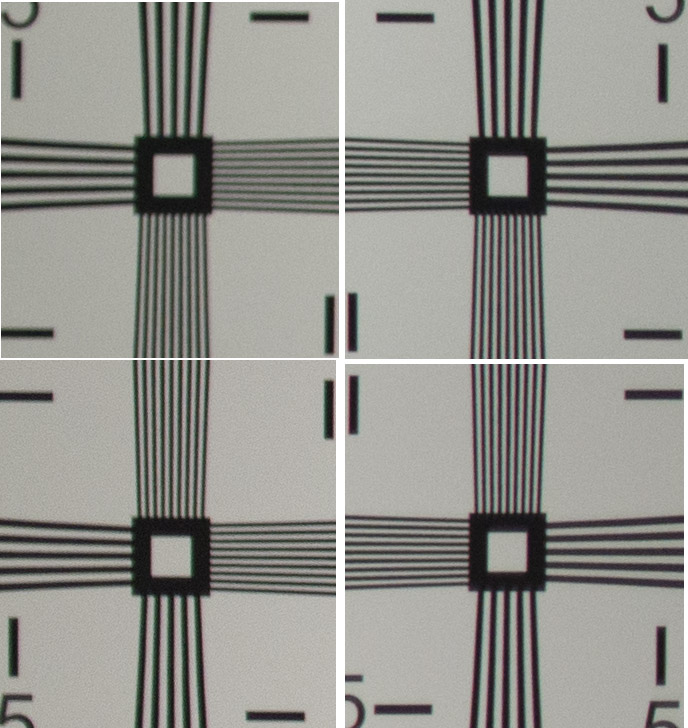
I don’t think there’s any question the left upper corner softness is noticeable with some pixel-peeping. I’m much less certain how noticeable it will be in a real photograph, particularly given it’s location. But certainly it might be. I did check and the difference between the 4 quadrants was about the same at f/4 and f/5.6 — all were sharper, of course, but there was still a noticeable difference.
This does provide a great demonstration of why I continually harp that checking center resolution is no way to test your lens. This copy of the Sigma lens is outstandingly sharp in the center. Only by comparing the 4 outer quadrants could you possibly tell something is a bit off with this lens. By the way, because I know it will come up in comments, this is something we see commonly in wide-aperture primes of all brands. It’s no more frequent with Sigma than Nikon or Canon.
Summary
There are three kinds of people: those who can count and those who can’t. – Author Unknown
I’m a geek and spend most of my days testing lens resolution; although mostly to detect copies that are out of sorts. I also test newly released lenses for MTF and resolution, too. Numerical results like Imatest measurements are invaluable for that kind of work. They give us reproducible data that we can use to set standards and compare things.
I think, though, that even just showing images of test charts illustrates some of the limitations these numbers have.
In the center of the lens, where aberrations are minimal, MTF50 correlates pretty well with perceived sharpness as long as we don’t try to split hairs. A difference of 200 line pairs / image height or roughly 20% is clearly visible. A difference of 100 line pairs / image height or 10% in total resolution is visible but probably requires side-by-side comparison. And that’s in a lab shooting test charts and pixel peeping. I’m interested to see what the difference in photographs is after postprocessing.
In the outer 1/3, though, the numbers are less meaningful. Sure, a big difference in MTF is obvious. But things like vignetting, aberrations, and field curvature may make a much larger difference in how the image looks. It’s nice to know the MTF, but I wouldn’t make a purchase on just that basis, ever.
And, of course, we still haven’t even considered real-world things like exposure, focus accuracy, and vibration. I’ve mentioned before autofocus isn’t nearly accurate enough to make MTF measurements, we require careful live view and even then focus bracket. That and other real-world factors are going to have a huge influence on images above and beyond any MTF differences.
Uwe has a follow up with some actual images shot with theses lenses, properly postprocessed from raw files on his website in the follow up article, Seeing the Numbers with Real World Images.
Then, perhaps, I’ll reevaluate our testing and see if other numbers beside MTF 50 might give more information when we evaluate lenses. That seems to be the standard among those who test lenses, although I’ve not seen good proof of why it’s the best number.
Roger Cicala and Aaron Closz
Lensrentals.com
February, 2013
27 Comments
Duane Pandorf ·
Love the tests you perform but waiting to see what you can get out of the new Leica APO-Summicron-M 50 mm f/2 ASPH!
Matt ·
Hi Roger,
Would it be an accurate assumption, when looking at the sharpness of two of lens rentals identical used lenses, if one was a 22, and the other was a 20, (about 9% difference) I probably would not notice the difference between the two. However, between a 20 and a 16 (20% difference), I would. Thanks for another great article.
Matt
Roger Cicala ·
Matt, that should be an accurate assumption. In a couple of months we’ll actually move to doing Imatest on all of the for-sale lenses, just so we’re using the same numbers everywhere.
Ben ·
I think I’m a little confused. When I look at the center resolution images and compare them to the ISO 12233chart (and examine the one I have at home.) I do not see any place on that chart that looks like the sample you’ve posted. Perhaps you can explain.
Roger Cicala ·
Ben,
Sorry about that – I used a computer generated ISO 12233 chart, but the ones we actually shoot have the center replaced with a star chart in a square, rather than the concentric circles in the example. The concentric circles don’t give much information these days – the original charts were made back in film days.
Max ·
Roger, can you please discuss how you extract the images from the camera? Straight JPEGS or RAW? Any in camera or post processing ? This is the mysterious part for us. Thanks!
Roger Cicala ·
Max, everything we imatest is raw straight from the camera and unsharpened. The images of ISO 12233 charts I show here are the same way.
Gleb ·
Regarding the 3 crops (Sigma at f/1.4, Nikon at f/1.4 and f/4):
Is it possible that the Nikon at f/1.4 was slightly front focused? The image looks greenish to me.
Fritz ·
Would the differences between lenses (center/corners) be as visible/more visible/less visible if instead of the D800 you had used a 20-24MP FF camera?
Roger Cicala ·
Fritz, that’s a good question. I suspect the differences would be about the same since with good lenses like these the lenses still outresolve the sensor, but it’s worth checking. I’ll put that on my to-do list!
Matthew ·
Roger,
Yet another great article, I was worried we wouldn’t be hearing from you for a bit because of your camera purchase. I’ve decided that in light of you always watching out for fanbois that I am going to become a fanboi of fanbois so I can still get upset reading your articles.
Keep up the good work.
Matt
Roger Cicala ·
Matthew, I have to admit it’s a couple of days late. I actually took pictures all weekend for the first time in months 🙂
Oliver ·
Roger,
Great article as usual!
Have you tried comparisons of “best corrected versions” of test shots? Since some things like chromatic aberration and distortion can be corrected (with varying degrees of success) in post-processing but may have a cost in resolution, it seems conceivable that a lower-performing lens with more “friendly” problems could yield better end results than a higher-performing lens with more difficult issues.
Oliver
Roger Cicala ·
Oliver,
I agree with what you say, but it would take an awful lot of data collection to tell. I think removing lateral chromatic aberration would probably be a low resolution cost, and correcting distortion would be high. But I’m not certain how they’d all pan out.
ginsbu ·
Thanks for the very informative comparison. I’m looking forward to seeing Uwe’s results!
One question: You say a couple of times that the Nikon 35/1.4 wasn’t designed for wide open resolution, but could you say more about what its strengths are? I looked at your take on the rental page, but the test results you report here don’t seem to match up with it—perhaps the Sigma has moved the goalposts for sharp when it comes to 35/1.4s?
Roger Cicala ·
ginsbu,
The Sigma definitely moved the bar, but the Nikon G is renowned for it’s bokeh and dreamy look. It’s wicked sharp at f/2.8, but wide open not so much. The Zeiss 50mm f/1.4 is a very similar lens. They give one look wide open, an entirely different look stopped down.
derek ·
thanks Roger, excellent test as usual.
I am glad I sold my AFS35mmf1.4G a year ago for the ZeissT*1.4/35ZF2.
I may get Canon 5D3 and go back to dual mount kit (D800e+D600 +5D3), so it was a great decision of me to have sold the Nikkor 35G for the Zeiss,which can be converted for Canon mount as well.
Anyway, I am pretty impressed with your copy of the AFS24-120f4GVR,which I also own.
Paul C ·
Interesting that you would us the Nikon 24 – 120 lens with the D800 for this test. That was one of the lenses that you specifically did not recommend for the D800 in your “D800 Lens Selection” post. Can you elaborate? is it because of weaker performance outside of the 35mm – 70mm range? At 35mm it seems to outperform the 16 – 35 lens in this test, yet the 16 – 35 was one of the lenses you did recommend. Is that because the 16 – 35 performs better at focal lengths wider than 35mm?
Roger Cicala ·
Paul,
It was Uwe’s suggestion and a good one. I had tested it at it’s extremes, but in the center of the zoom range it’s quite good. I need to make an addendum on the D800 lens selection page.
Roger
Oliver ·
Roger,
I’m definitely not suggesting that you test all possible lenses and correction schemes.
My comment was mostly motivated by the corner performance comparison and your comments that the Nikon 35 f/1.4G was visually soft. If you get a chance, would you be willing to try (just as a quick and dirty test) the same corner panels but with lens corrections enabled?
Uwe Steinmueller ·
>It was Uwe’s suggestion and a good one.
I wanted to know the 24-120mm f/4 VR data because with my latest sharpening routines I got surprised what this zoom can deliver. I reworked some aerial shots and go interesting results. So far the best results for aerials was with the 85mm f/1.8 lens but it is not nearly as versatile as the 24-120mm f/4 VR. Whether VR is a bonus or not for my aerials is not clear to me right now. I photograph from a friend’s Stinson 1947.
Uwe Steinmueller ·
Have a look at some of our aerials:
http://outbackphoto.smugmug.com/DOPMasterPortfolios/Aerials/
Click on show details to find camera information. We used over the last 3 years:
Nikon D800 +24-120mm
Nikon D800 +105mm Macro
Nikon D800 +70-200mm f/2.8 VR II
Nikon D800 +85mm f/1.8
Panasonic GH3 + 35-100mm
Fuji x-Pro1 and 85mm Zeiss for Leica mount
Sony NEX-7 and 85mm Zeiss for Leica mount
Canon 60D + 100mm Macro
Canon 60D + 24-105mm f/4
Chris ·
If anything I’m shocked to see how good the 24-120 truly performs…
Uwe Steinmueller ·
Here are some more images from this zoom:
http://www.outbackphoto.net/news/2013/2/27/nikon-24-120mm-f4-vr-field-test-gallery.html
James Scholz ·
Thanks Roger.
Horses for courses, as the English say.
A couple months ago I tested my Nikon 28 1.8, Nikon 24-70, and Tamron 24-70, all at 28mm, and at landscape distance. My results mirrored yours. On my D800E the center of all three looked pretty similar at 100%, but the edges were a different story. The 28 prime was noticably better, followed by the Nikon and then Tamron.
My tests told me that when the light is good or a tripod available to reach for the prime, but in poor light like a wedding reception without the tripod to reach for the softer edge image stabilized Tamron every time.
Siegfried ·
Roger,
I do not do this any that often, but I’m sure you need such feedback to keep the ball rolling: thanks a lot for another interesting, intriguing and wholesome post!
Cheers,
Zig
Maren ·
Dear Roger,
that was a very interesting article! I’m following your blog for some months now and I’m surely no geek but I will get a new lense in a few days and that’s why I’m interested in testing lenses. (The german “Fotoespresso” translated one of Your articles about testing lenses – since then I know Your blog.)
Your article gave me an impression about what the numbers (MTF) mean “in the real world”.
For me it means “Keep Cool” – there are differences and it makes sense to look for numbers, but hey “Keep Cool” I think I’m not bad at pixelpeeping, but I was misleaded by chromatic abberations e.g. …
In the end it’s a question of “can I afford the better lense” and “Can I keep my hands calm enough”? If not even the best camera-lense-combination which I really can’t afford won’t do the job. 😉
Best regards,
Maren