WARNING! THIS IS A GEEK LEVEL III ARTICLE. It’s about testing, not image making. If you’re into geeky testing stuff, you’ll probably find this fascinating. If you’re not into geeky stuff but are into how lenses change over time, you’ll find skimming it worthwhile. If you’re a Fanboy or Fangirl, there’s nothing here for you; there are no brand comparisons.
About This Testing
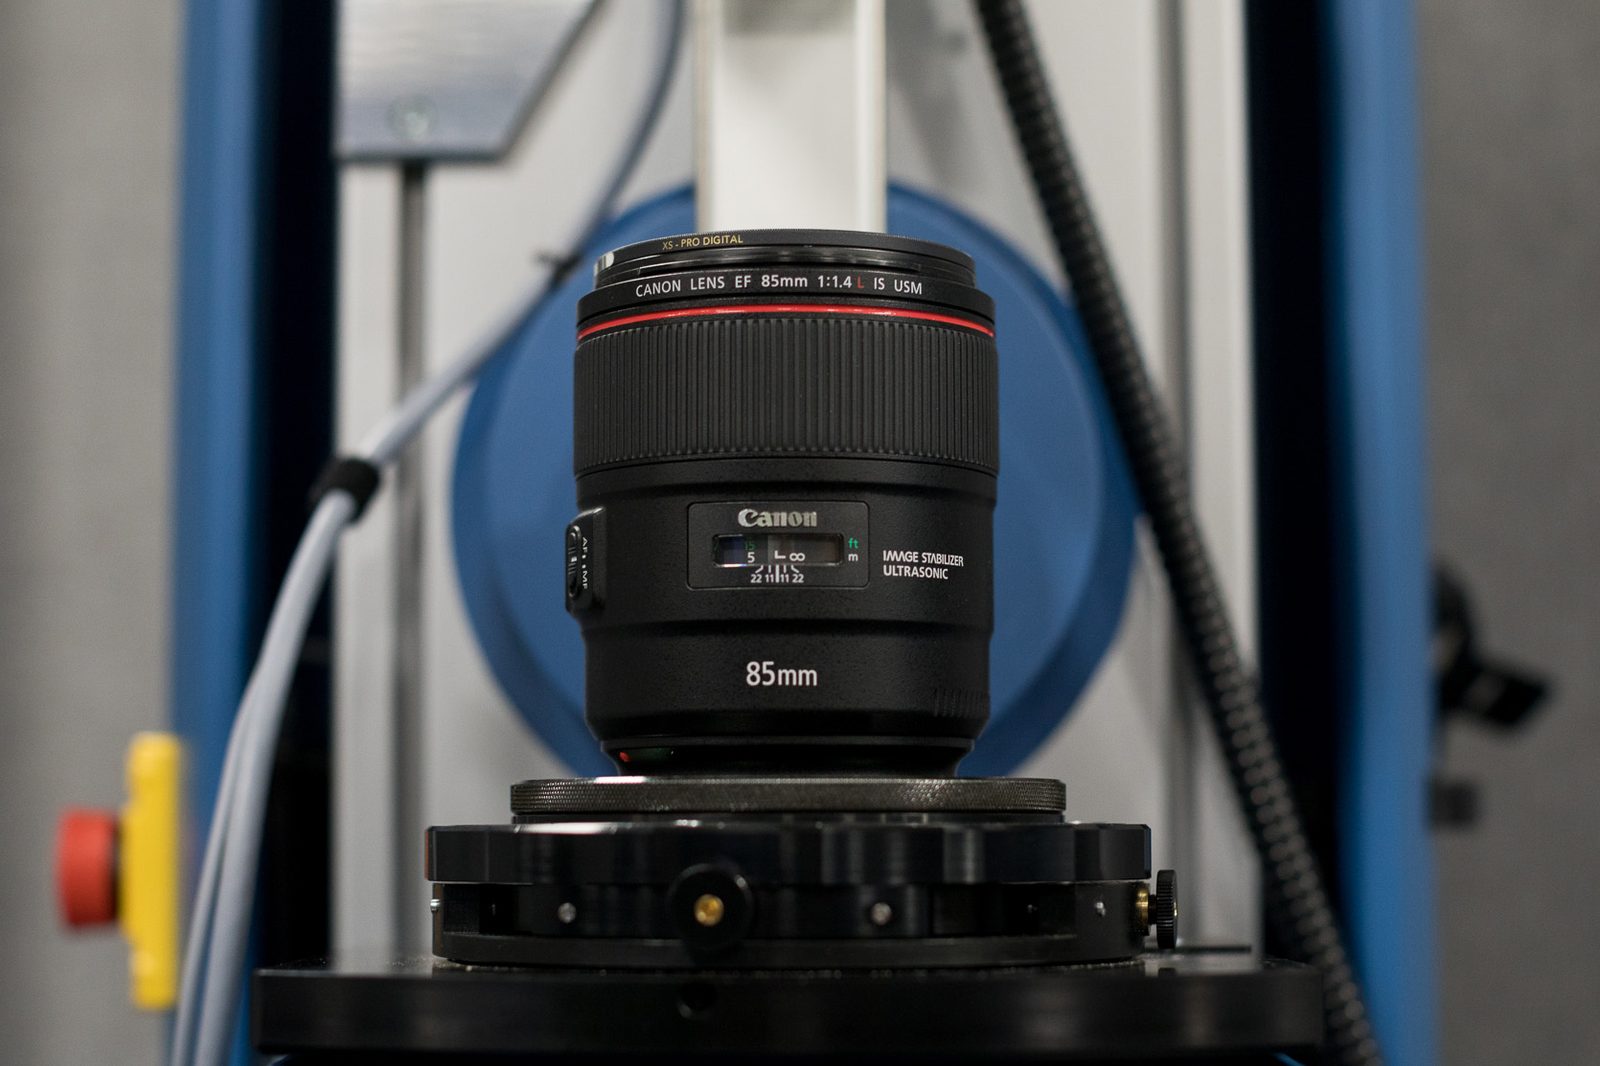
In a previous post, I wrote about the idea of rapid MTF Testing and how we got there. The three or four people who actually read it thought it was cool. We already had arguably (really it’s not arguable, but people like to argue) the best lens testing system available. But the test time was too long to test every lens after every rental. We tested a given lens every few months using our MTF system, but day to day used test-charts and lens projectors.
Ideally, testing should be to a higher standard than the actual use. Charts and projectors were good enough back in the days of film cameras, low resolution digital, and HD Video. But today, someone making 36 megapixel, 3-D images is finding out more about the lens than a 2-D projector or chart picture test could show. (Fun fact: a good lens on a 50-megapixel camera will let you see the individual print dots that make up the lines on commonly used test charts. How do you determine ‘line pairs of resolution’ when the lines have become dots?)
The Rapid MTF system is a ‘through focus’ test, so it shows lens performance in 3 dimensions; it detects tilts and decentering better than a chart or projector can. It also gives measured numbers at multiple points so we can keep the data for every test of every lens.
For the first time, we can look at how a given copy has tested multiple times over several months. Plus, there are, you know, numbers. “It dropped from 0.76 to 0.64” has more meaning than, “I think it might be softer than last time.” Of course, there’s no way one of our techs, testing 200 lenses a day, would possibly remember what it looked like last time.
After a year of development and a few months of beta testing, we knew that the new testing method worked. But we weren’t sure how much better it would be, or what other information it might give us. We’ve been using it for months now, tested thousands of lenses multiple times, and learned a lot.
Some of what we learned is about how much this improved our testing. Some of what we learned is about better ways to identify lenses that can be improved by adjustment in-house. Of course, like all things, some of what we learned goes under the ‘how could we be so stupid’ category. So this post is a combination of celebrating how great our new testing is and laughing at stupid Roger tricks.
Plus, like most of the stuff we do, we learned some things about the lenses that you may find interesting.
Looking at Data
Let’s start with a single test of a single lens. The computer graphs the test results and then checks six measurements to decide if the lens passes or fails. If the lens passes all six requirements it passes, as this one did.
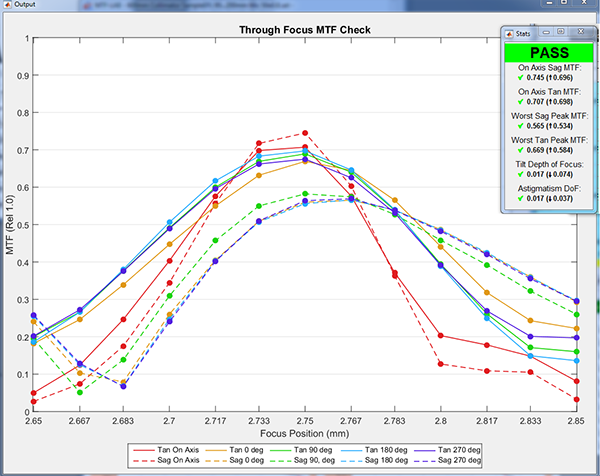
What are those six key measurements, you should ask? Basically, two are center sharpness (on axis Sag and Tan MTF), two are the worst corner being good enough (worst of the four Sag and Tan Peaks). Next is tilt (the horizontal axis is focus position; if the lens is tilted the four off-axis peaks don’t line up like the lens above; they are spread apart) and finally, astigmatism (if the sagittal and tangential have different focus positions).
Every lens is different, so how does the computer decide what’s passing and failing for a given lens? We start by using the MTF and variance data that we’ve published in blog posts for years and plug that in the program. But the program is self-learning. After it’s done hundreds of runs on a given lens, we tell it to recalculate its standards. With several lenses, after we ran a couple of hundred tests, the machine told us our standards were too low.
The opposite has happened a couple of times, too. Our initial standards were too high. When 14 of the first 16 lenses fail, we have to reassess standards. There are also very few lenses where ‘normal’ is nowhere near perfect. A couple of lenses, for example, have tilt in every single copy we’ve ever test (several dozen copies at least), so we have to override the program and tell it ‘do not fail for tilt.’
Results Over Time
One question I get asked a lot is ‘do lenses get softer with use?’ This type of testing lets us save the numerical results every time a lens is tested so we can look at that. An excel spreadsheet of all the test results for a given lens is really interesting. Here’s a tiny clip from a 1,000 plus row spreadsheet. This sheet was for Canon 50mm f1.2 results; I chose it because that’s a lens that requires frequent adjustment.
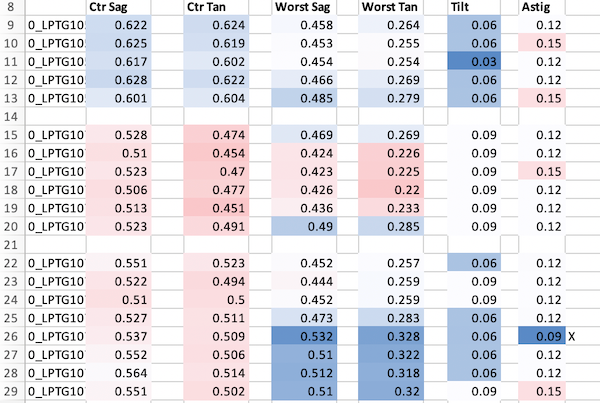
The empty rows separate three different copies of the lens; each lens tested after each rental. I did a crude conditional format for each column with dark blue being the best, dark red (there aren’t any here) being near-failing or failing. You can see the tendency that we see: a given lens tends to be similar with each repeated test.
It’s generally consistent enough so that any change stands out. I can then pull up that lens and see if anything happened to it. You’ve probably noticed the last lens in the table above had a change; it actually improved somewhat in its ‘worst corner’ readings. There’s an X in the column at the time of change. The X tells me one of our techs opened that lens up to remove dust before sending it for testing. Cleaning the dust out doesn’t improve the lens optically. However, with this lens, the elements have to be recentered after dusting the front. Our tech recentered it better than it came from the factory.
I’m going to show you a longer piece of the spreadsheet now, and let you scroll down it like I do when I review reports (except mine is over 1,000 rows long). Mostly this is to give you an illustration that a given copy doesn’t change very much over time. Granted this is only a few months, but each test is after the lens was shipped, used, and shipped back. You’ll have to take my word that if I showed you all the spreadsheets for hundreds of lenses over thousands of test runs, this is how they all look.
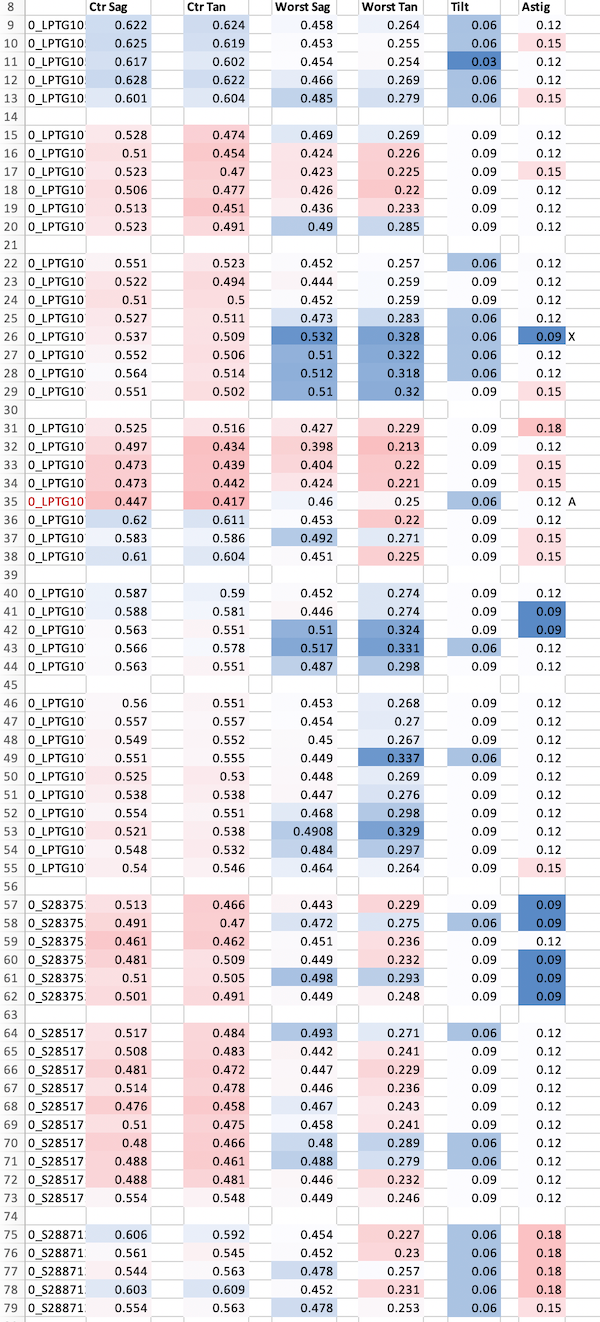
You may notice one other ‘event’ in the ones above. The lens under our first example has a change, and there’s an “A” for ‘adjusted optically,’ after that test. The point isn’t that the adjustment made it better (it did), but rather the lens was tested four times and passed, then failed with about the same results. This is the ‘tightening of range’ that I mentioned earlier. Our program showed us we should hold this lens to higher standards than we were.
More Problems
This next clip is from a different lens. This time I just pulled the problem lenses we found (well, and one problem we created).
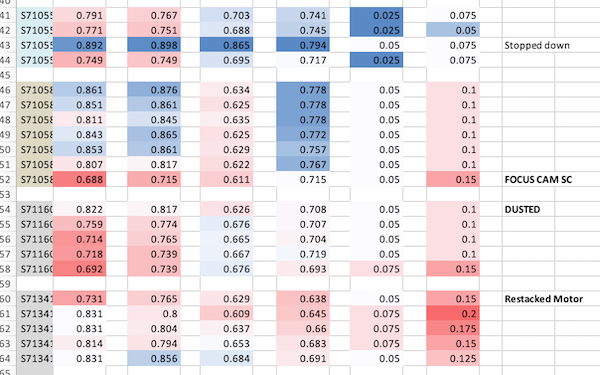
Too Good to Be True
We’ll start with the top because it’s one that made me go ‘DUH, we should have thought of that.’ That lens didn’t suddenly get better for one test run; the tech didn’t check to make sure the aperture was wide open before testing it. Once would have been funny, but it’s happened a dozen times (out of a few thousand test runs), so Markus is now adding a ‘too good to be true’ outcome to the software. We should have thought of this to start with. It’s important because testing a lens stopped down basically is not testing the lens. Some lenses that are awful wide open look fine stopped down a bit.
There was even more ‘we should have realized that’ usefulness in these ‘too good to be true’ test results. We found a high frequency of ‘stopped down’ results in one Cine lens. It turns out that the tech wasn’t at fault, the aperture wasn’t fully opening to maximum diameter when the aperture ring said it was. (It wasn’t a huge difference, for example, a T1.5 was probably set at T1.7 or t1.8 in reality.) It’s an easy adjustment to make, but we had been missing it before we started this kind of testing.
The Drop Kick, the Duster, and
The second lens in the set above is really the perfect example of why testing is important. After the test, we emailed the renter and asked if the lens had been dropped. He told us it had but that it had worked fine afterward, so he hadn’t mentioned it. We found a bent focusing cam inside and had to send it off to the service center.
The next one still passes (although barely) but is definitely worse since it was dusted. We pulled it off the shelf to readjust it after we saw this. It still passes, so just testing on a pass-fail basis we didn’t notice it. But looking at serial tests, we know it can be made better than it is because it used to be better than it is.
The last lens is another example of randomness: it didn’t fail its first optical test but was having AF problems, and one of our techs restacked the AF motor. It’s optically different after that; a bit sharper in the center but with more astigmatism at the edges. Again, it still passes, but disassembling and reassembling made it a bit different.
Another Look at Variation
We also have another redundant check that is a benefit of being able to store data for multiple tests. The example below is from yet a different lens. In this spreadsheet, we simply added high-to-low range for each lens (green cells). Remember, the first two columns are a center resolution, the next two weakest corner resolution, then tilt and astigmatism. This lens doesn’t have much tilt or astigmatism so we’ll ignore those.
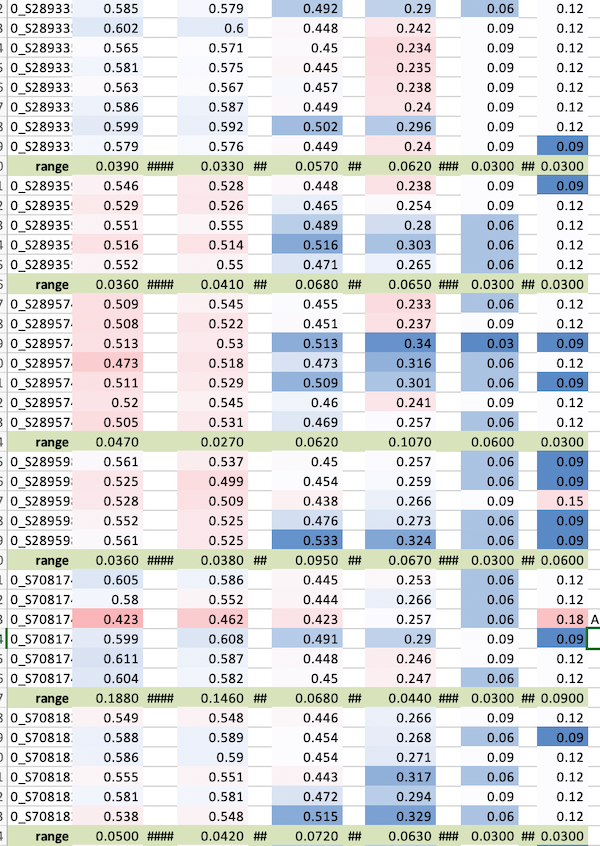
One lens, the second from the bottom, did have a failed result requiring optical adjustment. If you look at the ranges, you’ll see they’re very consistent among all the other lenses, basically less than 0.05 in the center and 0.07 in the worst corner. But the bad results gives a much higher range.
While that wasn’t necessary to identify the bad lens, it can help us identify bad test runs, copies that might have a little looseness inside and vary from test-to-test, or a type of lens that just has a lot more variation, which helps us set our standards (more on that in a bit).
We can take this a little further in summary reports. For right now, I have to import these by hand, so I’m only showing a few examples. In this sheet, I’ve highlighted the standard deviations for each test on each type of lens, and again colored them by percentiles, with red having the highest variation and blue the lowest. So where you see red, the lens has a lot of copy-to-copy variation, where you see blue, it has little.
Please don’t read too much into this; it’s just an interesting demonstration. I’ll be getting into accurate detail in future posts; this is just a preliminary overview. Remember, I have way more data on Canon lenses (600 to 1,000 tests per lens) because we have way more of them. Most of the others have only 100-300 test runs, their numbers may change a bit as more data comes in.
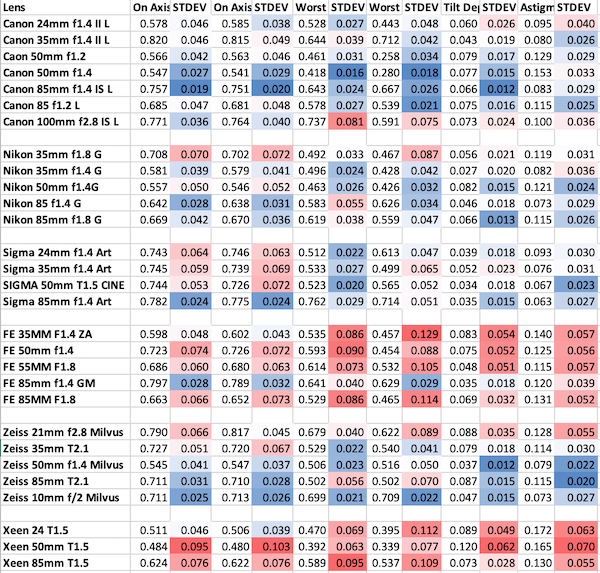
The points I’m trying to make aren’t which brands and lenses are best and worst (I’ll make that later). It’s simply to make the point that certain lenses, and to a lesser extent certain brands, have more variation than others. All of our tests simply make certain that the lens passes what its own standards are. If it’s variation is high out of the box, the variation is high.
As one example, I’ll show how this confirms something I’ve said for years. The Sony 35mm f1.4 ZA lens, is very consistent for center sharpness. If you get one, center sharpness will be good. The low variation our test shows in center sharpness confirms that. All of the 35mm f/1.4s seem to have a weak corner or side, though, and the red off-axis readings demonstrate that. If you get one, the corners are not likely to be equal. This is similar to what our variation graphs show when we do MTF testing, but it’s easier to compare a lot of lenses this way.
Summary
I guess my takeaway message here is several-fold. First, having historical data on a lens lets us do more than just ‘pass-fail’ testing. It can give feedback to techs about their repairs. We’re learning that with some lenses, at least, we can adjust optically to better than ‘good enough to pass.’ A year ago I was comfortable we had the best optical testing that anyone had. Now it’s better.
Probably the most pertinent point for you guys is that lenses don’t change over time very much unless something happens. They don’t change much with use, but they can change with abuse, even accidental abuse. If a lens gets dropped (even if it seems fine afterward) or repaired, it may well change optically.
Another point that I’ll expand on in a future post is for those who spend a lot of time and effort in ‘getting a great copy.’ Some lenses have such variation that you probably will have to go through at least dozens of copies if your definition of ‘great copy’ is ‘near perfect copy.’ If you limit your definition to something like ‘good in the center, I can live with bad corners’ or ‘I don’t mind some tilt’ then you really can find some great bargains.
Roger Cicala, Aaron Closz, and Markus Rothacker
Lensrentals.com
November, 2018

49 Comments
Sickheadache ·
All these Computations hurt my head.
mtnman1984 ·
Articles like this are the reason why I only rent from you Roger. I get the idea that making sure what you send out is right comes secondary to the fact that having a lens that is off within fifty feet sets off your “Spidey Senses” and it bugs you along with many of your techs. It’s obvious that you love what you do. Great work.
jkool ·
Another fascinating deep dive. Thanks for sharing these data sets with us and providing such thorough analysis.
Cameron Braun ·
Here’s the real question. Can I send a lens to you for calibration rather than sending it to Canon, even if it’s a lens that I own? This is fascinating, but at the same time I’ve always been suspect of Canon’s “in spec” designation when things return from CPS that don’t seem to be very accurate. I feel like I’d trust you way more than I trust Canon.
Roger Cicala ·
Unfortunately we have a 2-week back up for in-house repairs. We can’t take on any outside work.
Zak McKracken ·
I’m not even on the same continent as you, so having my lenses adjusted by you (or even renting) are not options to me — but now that we live in a universe where this kind of data and calibration method exists, and a demand from photographers to use it on their gear, it would be a shame if it didn’t become available to a wider audience.
Is there any way in which Lensrentals/Lensauthority could expand/franchise or otherwise contribute to the proliferation of the methods you developed to other places in the world? I’m imagining a thing where independent lens repair shops could get help to set up their own equipment, some training and access to your lens metrics database (in exchange for money, of course), and a badge of some kind, so discerning customers know what they’re paying for?
I’m an engineer and have no idea about business things but this stuff looks eminently useful to a lot more people (and lenses) than Lensrentals will ever be dealing with. And I’d be surprised if there weren’t a few lens repair places out there who would love to get their hands on something like this, too.
Lee ·
Fascinating as always, team! Thanks for this!
Ketan Gajria ·
Do you think you would ever start offering a service to adjust lenses that customers have bought themselves from retailers? I’m sure there are others like me who would pay quite a bit for such a service, but not sure if the scale of the demand out there would be worth setting up that system on your end. But really, please offer this. I’m so tired of testing multiples copies of a lens with every purchase and still finding disappointments.
Roger Cicala ·
Ketan, see below. We can’t keep up with our in-house repairs, so we can’t take on any outside work.
Ketan Gajria ·
Totally understood. Please try to expand if there’s an opportunity! Would make a lot of us happier about lens purchases.
hywelphillips ·
I’ll second this. I’m not normally in the market for renting lenses, but a reliable scientific test process to run my lenses through and get them all serviced if they’re out of spec? Or a way to buy a tested lens rather than “blind” and send it in for validation every so often? Shut up and take me money.
It does seem like you are about the only guys on the planet who have the data and the expertise to put such a business together. Obviously only you know whether such a business would be viable, but given the number of people on this thread who already jumped up and down with joy at the possibility, please do have a think about it!
Tom ·
I have read the comments below and know your answer already, but pretty please? I’m sure nicer begging without an evidence-backed argument is the way to win you over.
There must be a fair market value of offering outside lens calibration services that could allow you to recruit and hire a whole new team with a second calibration system and have a whiz-bang “Perfect Lens Offering” service.
It’s a weird world, so there are probably a good number of people that might be willing to shell out $500 on a brand new lens to have it “Roger’s Lab Certified”
Roger Cicala ·
Tom, they’d also be giving up the new lens warranty. You know the simple answer (for most lenses)? Buy a used one from Lensauthority. It’s been getting this kind of testing for most of 2018. To be complete, though, only prime lenses have been in this program this year, not all zooms get this treatment; and we aren’t testing m4/3, Fuji or Pentax yet.
And all of that being said, Roger recommends waiting a bit longer. As the article showed, we’re doing better now than we were in March or April. I think it will be January before I say ‘that’s a wrap’.
Tom ·
Oooh – Lens Authority used lenses. I didn’t put two and two together. That’s a good idea. No complaints on no zooms from my end. I don’t own a zoom, but I could use another extra sharp prime or two or three.
Bad pun – you could be like the Cutco for lenses: Free sharpenings for life with every purchase from Lens Authority with extended warranty.
Abraham Friedman ·
Interesting. I nearly pulled my finger on a lens from Lensauthority but didn’t since it’s being retired from the fleet precisely because it has so much wear and tear. I know optically it’s in good condition but a lens I owned for 2 years sat on a shelf for most of it. Lenses from a rental fleet see a lot more use and I was nervous about the longevity. I know you’re a bit biased but do you have any input on the validity of this fear?
Andre Yew ·
Thanks as always for the fascinating look into what you guys do behind the scenes. I noticed that some of the numbers have 3 significant digits, and I always have to wonder when I see numbers like that what the threshold of discrimination is for the system. For example, is it significant that one lens’ number is say 0.001 more than another one’s, or is that within the error bars of the system? Some of the astigmatism and tilt numbers seem to jump by 0.03 unit steps, and that’s always an interesting kind of behavior too.
And on an unrelated note, what are the chances that there will be a Z-mount adapter for OLAF?
Roger Cicala ·
This is just quick excel spreadsheets, I wasn’t looking for significant numbers so I left everything at 3 decimal places.
The tilt and astigmatism numbers for most lenses tend to be simpler measurements. Rather than running on a 0.000 to 1.000 scale like MTF does, those are actual mm of focusing difference. Since the most common focusing range is 0.3mm done in 10 steps, they move in 0.03 increments.
Andreas Werle ·
Great “Geek Article” as ever, Roger. Thanks for that – and yes I would appreciate if you would eventually offer “outside work”.
Nikolaj Karpov ·
In a world you can’t trust vendors such service definitely has a market opportunity.
joe guide ·
Roger,
I hope you are selling your MTF machines to the lens manufacturers for QA, as well as the data you are accumulating on the cameras over time. They can certainly use your help in their Deming methodology.
Just make sure to charge the heck out of your service.
JoeG
Roger Cicala ·
We don’t sell the machines, Trioptics GMB does. But we’ve already offered to give our methodology to a couple of manufacturers.
Patrick Chase ·
I used to work in imaging, and our optical engineers had broadly similar capabilities. From a scientific perspective there is nothing novel here, though LR seem to have done a very nice job of smoothing out the workflow and making it economically viable for routine inspection of relatively inexpensive photographic lenses.
Any major lens manufacturer would have these sorts of capabilities in house, though that is not to say that they actually use them in production.
Larry Templeton ·
That’s one reason why this entire process is interesting to me. It’s not as if Canon doesn’t have the talent or money to test and evaluate on this level—but that they haven’t found a way to communicate it and make it applicable in a way that their “L series” customer would care about—and thus would also likely pay some premium for.
Even mid-grade computer monitors come with a test sheet now, showing many of its variances “within spec.” Yet you can still spend $1K-$5K on a lens and almost never receive anything but a “Grade A Beef” stamp or sticker.
That’s one side—the task of guaranteeing and communicating specs—but instances where Roger & Co. are able to adjust a lens to a “better than factory” specification, that certainly suggests that they are able to do something useful (at a scale of economy that can’t even be compared) that the big lens makers are either strangely unaware of, or strangely shrugging off.
A third, and extremely helpful component to these fancy (or “not so fancy” as you might say) tests is the publication of data regarding blatant quality issues—for example, Sony’s $1,600 lens that is rarely, if ever, uniformly in focus across the frame.
Lens manufacturers appear quicker to fall on their sword than admit to a production issue (let alone announce a fix)—so Roger’s testing is both a fascinating look into how these instruments function, and a much needed check on the hubris and massive marketing budgets of lens makers, who seem oddly okay with selling a $1,600 prime lens (just one example) with flaws that no one would expect, and that should not exist at that price.
David Bateman ·
Great work!
Trust me, more than 4 people have read this.
So now is the time to jump into Lens Authority, before you’re all sold out in February?
How long do you hold stuff until you sell it?
Roger Cicala ·
David, if you’re talking about how long it stays at Lensauthority, it depends very much on what it is. Canon lenses may sell in a few days, Cine lenses may stay there for months. If you’re referring to how long before Lensrentals equipment goes to LA, at most 24 months, but often less (lower demand for an item, etc. may mean selling it sooner).
David Bateman ·
Thank you for the reply. I had ment how long before you clear the lens rentals inventory. Less than 24 months is interesting.
Can you add a ZWO ASI1600MM to your rentals. I wouldn’t mind getting one in a year.
Graham Stretch ·
Hi Roger.
Thanks for a great geek article and for the humour you inject in your writings, every article has the chuckle factor.
How do you know if a reading is changing due to repeatability errors or because it is actually changed?
I have thrown a couple of ‘cheap’ gadgets at the workshop wall when they displayed a complete lack of repeatability after hours of adjustments based on their readings! (Easily frustrated by costly ‘cheap’!)
I’m not suggesting that I doubt your practices but there must be repeatability variation, is it several decimal points to the right or??
Cheers, Graham.
Roger Cicala ·
Hi Graham,
You can kind of see what we’re doing over time in the green rows in the spreadsheet. That showed range but we look at SD and other variations. Basically, as we get more and more tests over time we’re looking at any deterioration over time, rather than the noise of random variation (rising and lowering); plus some other math comparing (eventually) every lens 1, 3, 6, 9 etc. month readings.
As for repeatability, of course we measure for the test with ‘same sample repeat measurements’, testing a small group of lenses over and over. Makes sense if you think about it but for each lens type (not copy) there are slightly different test repeatability. They’re pretty small, though, and test-to-test variation on a given lens is a few % for the 4 MTF readings. Variation is larger for tilt and astigmatism because the measurements are cruder, and the numbers are less significant. That’s OK fr our purposes since those two measurements are basically either ‘some’ or ‘too large to measure’.
Graham Stretch ·
Hi Roger.
Thank you for the added detail of your response. Your tests must take ages even for the ‘rapid’ MTF tests, no wonder you are backed up and unable to offer this service to the public. Thorough takes time even for quick tests. ?
Cheers, Graham.
Reed Loefgren ·
In future, what might be the availability of data on a specific lens type, over time? I’m just a duffer shooting B&W film with some Leica M primes. I’ll never see validation of their raw optical performance but I am interested in their mechanical robustness over time because I don’t baby them. My guess would be that rented lenses are treated with a little less care because, hey, they’re rentals and insured. That’s a pretty good petri dish for one’s lens X that is not rented but owned. In any case, another great article. Thanks.
Roger Cicala ·
Reed, we do keep data on repair frequency, but we only keep lenses for 2 years, so in some ways it’s more about ‘what’s likely to break’ and less about ‘how long will it last’.
Athanasius Kirchner ·
Roger: You deserve an award for this work, or at least a published article in a reputable journal. It’s outstanding, groundbreaking and generally impressive. But perhaps more than that, it’s incredibly generous of you to take the time to write a nice, readable article to show all of your valuable work off (and make us lens nerds incredibly insecure about our gear).
I really, really hope you can sell your method to manufacturers. We, as customers, deserve the best; and you deserve a nice couple of millions to roll around in!
Cassandra Cain ·
I mostly earn somewhere around $20,000-$21,000 monthly through the internet. After working so passionately, I ended up losing my job in my company where I have given lots of years. I really needed a reliable source of income. I am not into “get rich overnight” package deals as you can see all around the internet. Those are all kind of ponzi network marketing strategies where you are required to first make interested customers and then sell a product to family and friends or any person so that they will be in your team. Internet job has amazing benefits for instance I am always home with my family and friends and can relish a lot of free time and go out for family trips. Here’s the fastest way to start >>> https://bubyenko.tumblr.com
Carmen B. Rodriguez ·
I usually make approximately $16000-$17000 monthly using the internet. After doing work so passionately, I ended up losing my job in my company where I have given lots of years. I truly needed a reliable income source. I am not into “get rich overnight” package deals as you can see all around the internet. Those are all kind of ponzi referral marketing programs where you are required to first make interested customers and then sell a product to family and friends or any person so that they will probably be in your team. online work provides amazing benefits such as I am always home with my family members and can really enjoy loads of leisure time and go out for family trips. Here’s the simplest way to start >>> https://cotcatio.tumblr.com
hjwulff ·
Once again, an outstanding article with data and facts. A light in the darkness, and much appreciated.
waldoh ·
Any chance you will be testing the new Sony 24mm f1.4?
Roger Cicala ·
We will as soon as we have enough in stock. The first batch all went out on immediate rental.
Ilya Zakharevich ·
«two are the worst corner being good enough»
Probably you mean: two are the worst “section” being good enough.
Roger Cicala ·
True. Semi corner or outer quadrant would be better terminology.
Ilya Zakharevich ·
You wrote: «Ketan, see below» in one of the replies. PEDANTIC: Note that this may be confusing (I was confused for a moment!). Discus allow changing sort direction of comments…
Larry Templeton ·
Don’t older comments always show up “below” for you on Disqus? The way this plugin keeps comments sorted is one of the things I like about it most. ????
obican ·
Roger Cicala (from Lensrentals.com) says Sony 35/1.4 ZA resolves reds much more deviantly in the corners than a thousand Canon lenses combined.
In other news, I’d love to see how the old Canon 24-70/2.8(Amazon link here) would’ve looked. That was the one that would consistently go worse after a few years due to some rollers wearing out(or something like that), right?
Oppen ·
Roger – how about LensRentals setting up a program to test factory fresh lenses and certify the ones with outstanding results for re-sale? I would pay a premium to buy a lens from variable production knowing that it was one of the “good ones.”
Roger Cicala ·
But what do I do with all the not outstanding ones? Can’t return them, they meet manufacturer’s specs. Can’t sell them for full price, who wants to pay full price knowing it’s ‘not quite great’.
RLThomas ·
Yeah, that would be a challenge. Too bad you can’t buy a batch, test, sort and price them accordingly. So-so copies could go directly into the rental inventory and the top performing 10-15% of the copies could be sold as “certified” either immediately after testing or after a brief stint in the rental fleet to help recover costs. All the certified copies would have individual MTFs with pricing on a scale based on condition and actual test data. Personally, I would rather pay full price plus some for a “like-new” copy of a lens that I knew had been thoroughly tested and was backed by LR service even if that meant buying it “used” with a 3rd party warranty. That way, I would know up front what trade-offs I was accepting. Given the labor and other costs involved, I suspect this could easily add a few hundred dollars to the price, making it impractical for all but the more expensive professional lenses.
It may be a delusion, but it’s a happy one.
Larry Templeton ·
When you receive new lenses, perhaps you can match their grade to a sliding scale (with a profit margin built in) that allows for lenses that *do* meet manufacturer’s specs but aren’t “as good” to be sold below MSRP—to those of us who aren’t Geek Level mk III obsessives—and the über specimens priced higher than MSRP. To the extent that you can scale up that initial testing, you can, potentially, sell that many more lenses, without spending any time to improve quality.
In a perfect world (where, ironically, lenses can’t be manufactured to identical specs) the above pricing adjustment seems like the fairest, most logical way to sell lenses in the first place.
taildraggin ·
Rog: I’ve rented, then bought a couple of lenses from you because they performed very well. I’d rather buy one of your very clean, “certified-not-bad”* lenses at or near ‘new’ prices than the gamble of getting a dog, off-the-shelf. (Even though new gen lenses probably have less variation than old(?).)
LA could price rank, much like KEH, sales based on catagories, graded by the (attached) analysis. I’d pay for that knowledge, regardless of warranty.
There are a couple of cranky retired pros whose brains I pick at our coffee shop – most still buy (or are given) 5 or more copies of every lens to chose the best and send back the rest.
* – viz impossible, improbable “Certified Perfect”
Cheers, TD
Carleton Foxx ·
Which are you: A divine messenger descending from heaven to lift the veil of metrological ignorance? Or a fiend clawing his way out of hell to torment us with visions of optical perfection that will forever remain unattainable?
eighthday42 ·
Really appreciate your in depth article Roger. I also appreciate how well maintained all of your rental equipment is. This is why I rent from you. This is also why I decided to buy the Voigtlander 15mm E-Mount lens I rented from you because this lens is known for some variation and I know you would have made the necessary adjustments to bring it to as near perfect as possible. Keep up the great work you do!