Warning: This is a Geek Level 3 article. If you aren’t into that kind of thing, go take some pictures.
I’ve been writing and discussing the copy-to-copy variation that inevitably occurs in lenses since 2008. (1,2,3,4) Many people don’t want to hear about it. Manufacturers don’t want to acknowledge some of their lenses aren’t quite as good as others. Reviewers don’t want to acknowledge that the copy they reviewed may be a little better or a little worse than most copies. Retailers don’t want people exchanging one copy after another trying to find the Holy Grail copy of a given lens. And honestly, most photographers and videographers don’t want to be bothered. They realize lens’ sample variation can make a pretty big difference in the numbers a lens tester or reviewer generates without making much difference in a photograph.
It does matter occasionally, though. I answered an email the other day from someone who said, in frustration, that they had tried 3 copies of a given lens and all were slightly tilted. I responded that I’d lab-tested over 60 copies of that lens, and all were slightly tilted. It wasn’t what he wanted to hear, but it probably saved him some and his retailer some frustration. There’s another lens that comes in two flavors: very sharp in the center but weaker in the corners, or not quite as sharp in the center but stronger in the corners. We’ve adjusted dozens of them and can give you one or the other. Not to mention sample variation is one of the causes that make one review of a lens say it’s poor, when other reviewers found it to be great.
At any rate, copy variation is something few people investigate. And by few, I mean basically nobody. It takes a lot of copies of a lens and some really good testing equipment to look into the issue. We have lots of copies of lenses and really good testing equipment, and I’ve wanted to quantify sample variation for several years. But it’s really, really time-consuming.
Our summer intern, Brandon Dube, has tackled that problem and come up with a reasonably elegant solution. He’s written some Matlab scripts that grab the results generated from our Trioptics Imagemaster Optical Bench, summarizes them, and performs sample variation comparisons automatically. We’re going to eventually present that data to you just like we present MTF data: when a new lens is released we’ll also give you an idea of the expected sample variation. Before we do that though, we need to get some idea of what kind of sample variations should be expected.
For today, I’m going to mostly introduce the methods we’re using. Why? Because I’m old fashioned enough to think scientific methods are still valid. If I claim this lens scores 3.75 and that lens scores 5.21, you deserve to know EXACTLY what those findings mean (or don’t mean) and what methods I used to reach those findings. You should, if you want to, be able to go get your own lenses and testing equipment and duplicate those findings. And maybe you can give us some input that helps us refine our methods. That’s how science works.
I could just pat you on the head, blow some smoke up your backside, call my methods proprietary and too complex, and tell you this lens scores 3.75 and that lens scores 5.21, so you should run out and buy that. That provides hours of enjoyment fueling fanboy duels on various forums, but otherwise is patronizing and meaningless. Numbers given that way are as valid as the number of the Holy Hand Grenade of Antioch.
Methods
All lenses were prescreened using our standard optical testing to make certain the copies tested were not grossly decentered or tilted. Lenses were then measured at 10, 20 ,30, 40, and 50 line pairs per mm using our Trioptics Imagemaster MTF bench. Measurements were taken at 20 points from one edge to the other and repeated at 4 different rotations (0, 45, 90, and 135 degrees), giving us a complete picture of the lens.
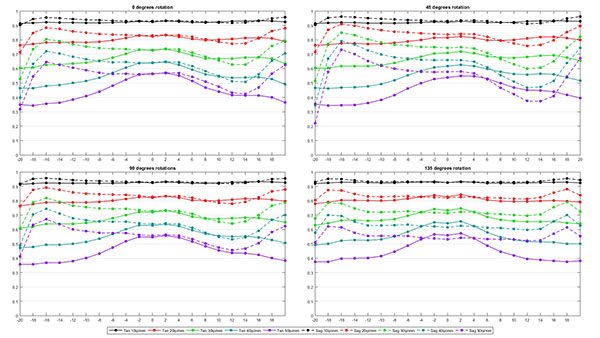
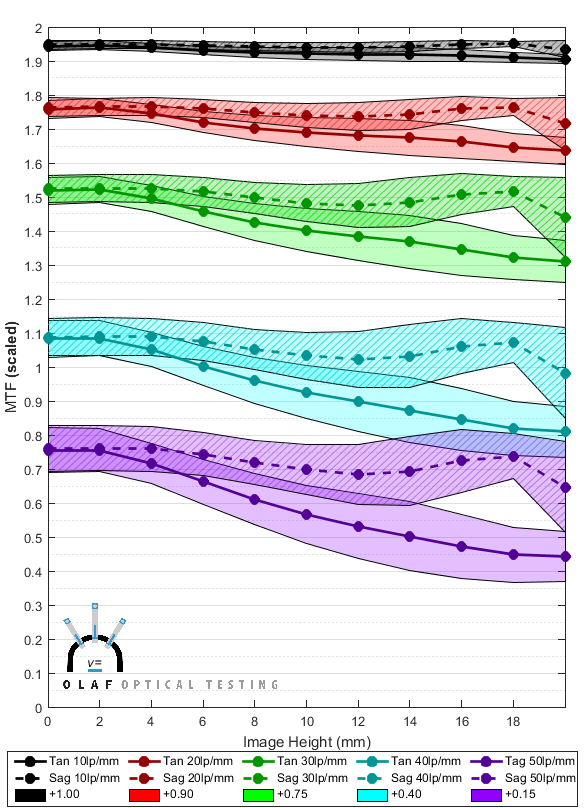
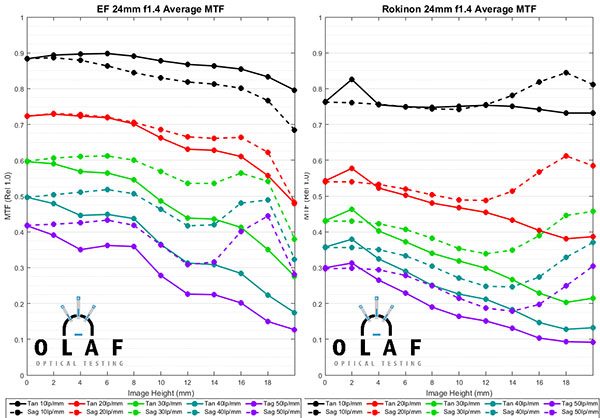
The 4 rotation values were then averaged for each copy, giving as a graph like this for each copy.
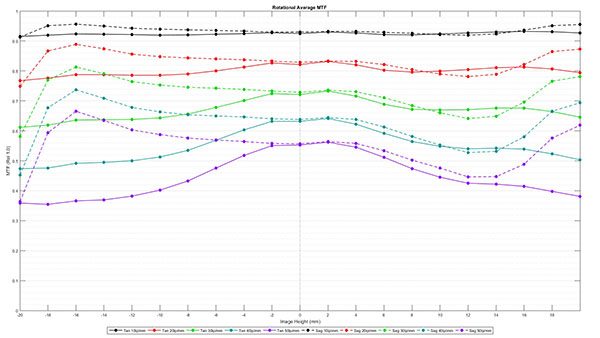
The averages for 10 copies of the same lens model were then averaged, giving us an average MTF curve for the 10 copies of that lens. This is the type of MTF reading we show you in a blog post. The graphics are a bit different than we’ve been using, but that’s because we’re generating these with one of Brandon’s scripts now, so they’ll be more reproducible now.
Graphing the Variation Between Copies
Every copy of the lens is slightly different than this ‘average’ MTF and we want to give you some idea of how much variance exists between copies. A simple way is to calculate the standard deviation at each image height. Below is a graph showing the average value as lines, with the shaded area representing 1.5 standard deviations above and below the average. In theory, (the theory doesn’t completely apply here, but it gives us a reasonable rule of thumb) MTF results for 98% of all copies of this lens would fall within the shaded areas.
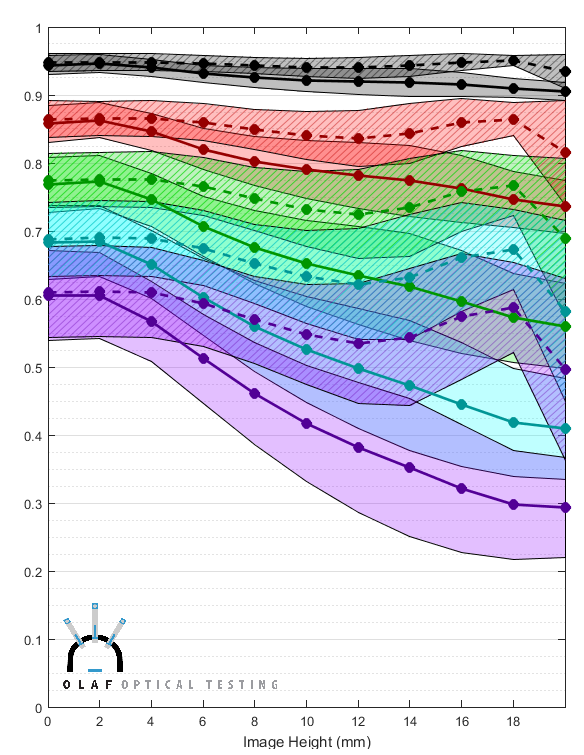
Obviously, these area graphs overlap so much that it’s difficult to tell where the areas start and stop. We could change to 1 or even 0.5 standard deviations and make things look better. That would work fine for the lens we used in this example, but this is actually a lens with fairly low variation. Some other lenses vary so much that they would just make a graph that basically is nothing but completely overlapping colors, even if we showed +/- one standard deviation.
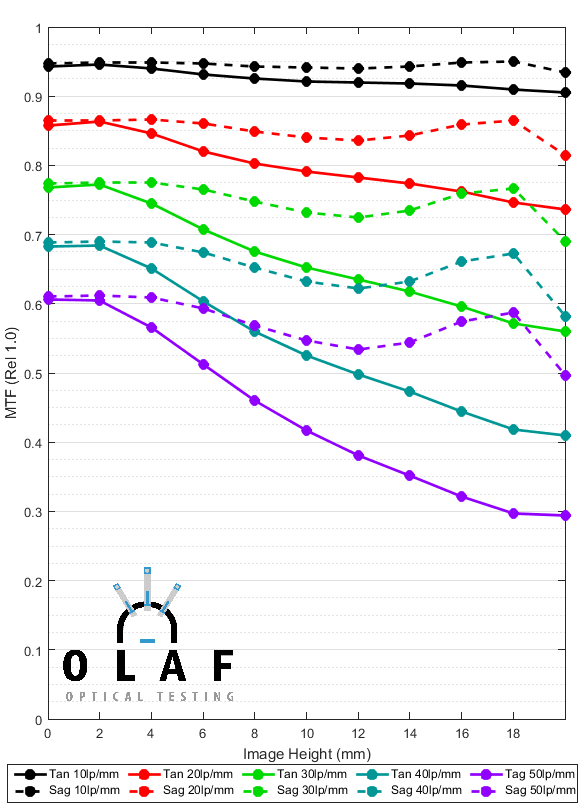
The problem of displaying lens variation is one we’ve struggled with for years; most variation for most lenses just won’t fit in the standard MTF scale. We have chosen to scale the variance chart by adding 1.0 to the 10lp/mm value, 0.9 to the 20 lp/mm value, 0.75 to 30lp/mm, 0.4 to 40lp/mm, and 0.15 to 50lp/mm. We chose those numbers simply because they make the graphs readable for a “typical” lens.
Graph 3 presents the same information as Graph 2 above, but with the axis expanded as we described to make the variation more readable.
You could do some math in your head and still get the MTF numbers off of the new graph, but we will, of course, still present average MTF data in the normal way. This graph will only be used to illustrate variance. It can be quite useful, though. For example, the figure below compares the graph for the lens we’ve been looking at on the left, and a different lens on the right.
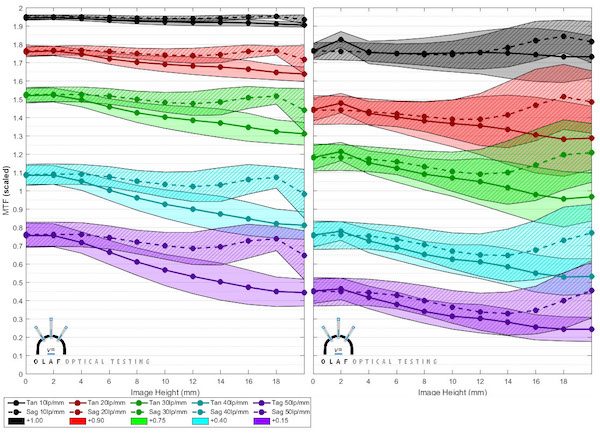
Some things are very obvious at a glance. The second lens clearly has lower MTF than the first lens. It also has a larger variation between samples, especially as you go further away from the center (center is the left side of the horizontal axis). In the outer 1/3 of the lens, in particular, the variation is extremely large. This agrees with what we see in real life: the second lens is one of those lenses that every copy seems to have at least one bad corner, and some more than one bad corner. Also if you look at the black and red areas at the center of each lens (the left side of each graph) even the center of the second lens has a lot of variation between copies. Those are the 10 and 20 line pairs per mm graphs and these differences between copies in the center are the kind of thing that most photographers would notice as a ‘soft’ or ‘sharp’ copy.
The Variation Number
The graphs are very useful to compare two or three different lenses, but we intend to compare variation for a lot of different lenses. With that in mind we thought a numeric ‘variation number’ would be a nice thing to generate. A table of numbers certainly provides a nice, quick summary that would be useful for comparing dozens of different lenses.
As a rule, I hate when someone ‘scores’ a lens or camera and tries to sum up 674 different subjective things by saying ‘this one rates 6.4353 and this one rates 7.1263’. I double-secret hate it when they use ‘special proprietary formulas you wouldn’t understand’ to generate that number. But this number is only describing one thing: copy-to-copy variation. So I think if we show you exactly how we generate the number then 98% of you will understand it and take it for what it is, a quick summary. It’s not going to replace the graphs, but may help you decide which graphs you want to look at more carefully.
(
It’s a fairly straightforward process to find the number of standard deviations needed to satisfy some absolute limits, for example, +/-12.5%. Just using the absolute standard deviation number though, would penalize lenses with high MTF. If the absolute MTF is 0.1, there’s not much room to go up or down while if it’s 0.6, there’s lots of room to change. This meant bad lenses would seem to have low variation scores while good lenses would have higher scores. So we made the Variation number relative to the lens’ measured MTF, rather than an absolute variation. We simulated the score for lenses of increasingly high resolution and saw the score would rise exponentially, so we take the square root of it to make it close to linear.
Initially we thought we’d just find the worst area of variability for each lens, but we realized some lenses have low variation across most of the image plane and then vary dramatically in the last mm or two. Using the worst location made these lenses seem worse than lenses that varied a fair amount in the center. So we decided to average the lens’ MTF across the entire image plane. To keep the math reasonable, we calculated the number just for the 30 line pair per mm (green area in the graphs) variance, since that is closest to the Nyquist frequency of 24MP-class full-frame sensors. Not to mention, higher frequencies tend to have massive variation in many lenses, while lower frequencies have less variation; 30lp/mm provides a good balance. Since some lenses have more variation in the tangential plane and others the sagittal, we pick the worse of the two image planes to generate the variance number.
Finally we scale the score to get a reasonable scale.
For those who speak computer better than we can explain the formula in words, here’s the exact Matlab code we use:
T3Mean = mean(MultiCopyTan30); S3Mean = mean(MultiCopySag30); Tan30SD_Average = mean(MultiCopySDTan30); Sag30SD_Average = mean(MultiCopySDSag30);
ScoreScale = 9; if T3Mean > S3Mean TarNum = 0.125*T3Mean; else TarNum = 0.125*S3Mean; end
if Tan30SD_Average > Sag30SD_Average ScoreTarget = TarNum*T3Mean; VarianceScore = ScoreTarget/Tan30SD_Average; MTFAdjustment = 1 - (T3Mean/(0.25*ScoreScale)); VarianceScore = sqrt(VarianceScore*MTFAdjustment); else ScoreTarget = TarNum*S3Mean; VarianceScore = ScoreTarget/Sag30SD_Average; MTFAdjustment = 1 - (S3Mean/(0.25*ScoreScale)); VarianceScore = sqrt(VarianceScore*MTFAdjustment); end VarianceNumber = VarianceScore*ScoreScale;
(</Geek off)
Here are some basics about the variance number —
- A high score means there is little variation between copies. If a lens has a variance number of over 7, all copies are pretty similar. If it has a number less than 4, there’s a lot of difference between copies. Most lenses are somewhere in between.
- A difference of “0.5” between two lenses seems to agree with our experience testing thousands of lenses. A lens with a variability score of 4 is noticeably more variable than a lens scoring 5, and if we check carefully is a bit more variable than one scoring 4.5
- A difference of about 0.3 is mathematically significant between lenses of similar resolution across the frame.
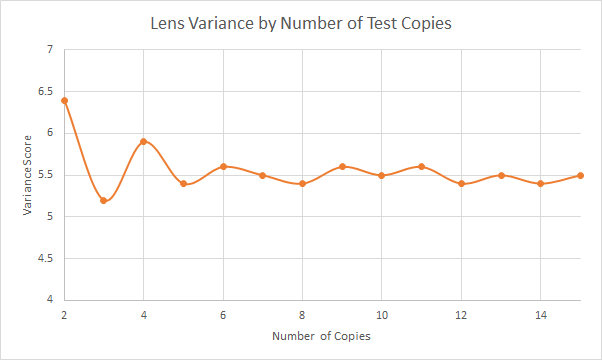
- Ten copies of each lens is the most we have the resources to do right now. That’s not enough to do rigid statistical analysis, but it does give us a reasonable idea. In testing 10 copies of nearly 50 different lenses so far, the variation number changes very little between 5 and 10 copies and really doesn’t change much at all after 10 copies. Below is an example of how the variance number changes as we did a run of 15 copies of a lens.
Some Example Results
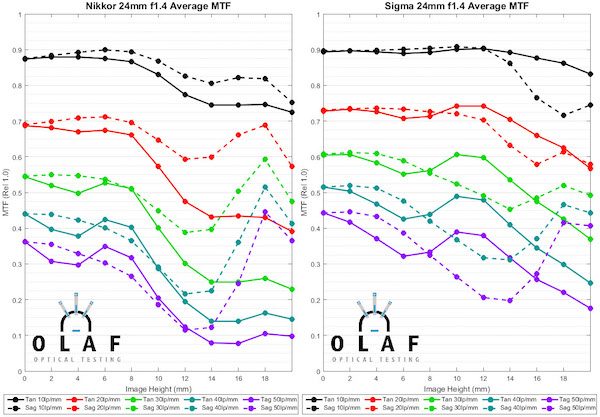
The main purpose of this post is to explain what we’re doing, but I wanted to include an example just to show you what to expect. Here are the results for all of the 24mm f/1.4 lenses you can currently buy for an EF or F mount camera.
First, let’s look at the MTF graphs for these lenses. I won’t make any major comments about the MTF of the various lenses, other than to say the Sigma is slightly the best and the Rokinon much worse than the others.
Now lets look at the copy-to-copy variation for the same for lenses. The graphs below also include the Variation Number for each lens, in bold type at the bottom.
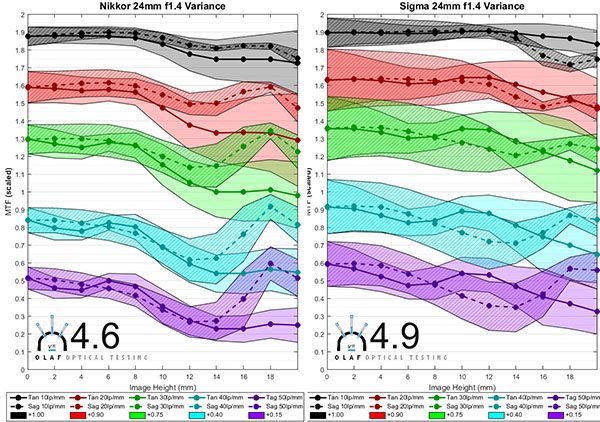
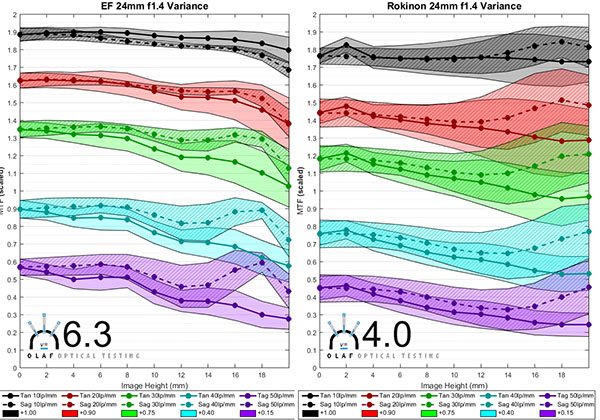
Just looking at the variation number, the Canon 24mm f/1.4L lens has less copy-to-copy variation than the other 24mm f/1.4 lenses. The Rokinon has the most variation.
The Nikon and Sigma lenses show an interesting point. Looking at the graphs the Sigma clearly has more variation, but the Sigma variation number is only slightly different than the Nikon number. That’s because the average resolution of the Sigma is also quite a bit higher at 30lp/mm and the formula we use considers that. If you look at the green variation areas you can see that the weaker Sigma copies will still be as good as the better Nikon copies. But this is a good example of how the number, while simpler to look at, doesn’t give the whole picture.
The graphs show something else that is more important than the simple difference in variation number. The Sigma lens tends to vary much more in the center of the image (left side of the graph) and the variation includes the low frequency 10 and 20 line pairs per mm areas (black and red). The Rokinon tends to vary extremely in the edges and corners (right side of the graph). In the practical world, a photographer carefully comparing several copies of the Sigma would be more likely to notice a slight difference in overall sharpness between the lenses. The same person doing careful testing on several copies of the Rokinon would probably find each lens has a soft corner or two soft corners.
Attention Fanboys: Don’t use this one lens example and start making claims about this brand or that brand. We’ll be showing you in future posts that at other focal lengths things are very different. Canon L lenses don’t always have the least amount of copy-to-copy variation. Sigma Art lenses in other focal lengths do quite a bit better than this. We specifically chose 24mm f/1.4 lenses for this example because they are complicated and are very difficult to assemble consistently.
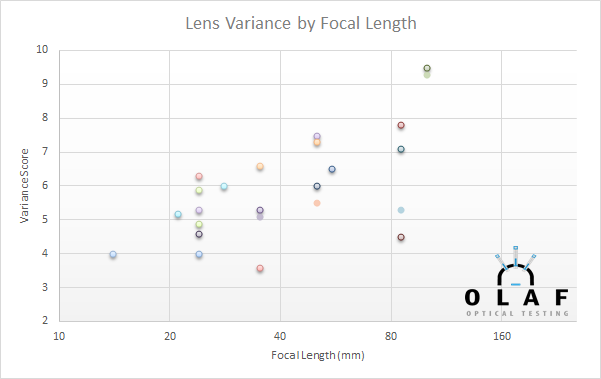
And just for a teaser of things to come, I’ll give you one graph that I think you’ll find interesting, not because it’s surprising, but because it verifies something most of us already know. The graph below is simply a chart of variation number of many lenses, sorted by focal length. The lens names are removed because I’m not going to start fanboy wars without giving more complete information. And that will have to wait a week or two because I’ll be out of town next week. But the graph does show that wider-angle lenses tend to have more copy-to-copy variation (lower variation number), while longer focal lengths, up to 100mm, tend to have less variation. At most focal lengths, though, there are some lenses that have little, and some lenses that have a lot of copy-to-copy variation.
What Are We Going to Do with This?
Fairly soon, we will have this testing done for all wide-angle and standard range prime lenses we carry and can test. (It will be a while before we can test Sony e-mount lenses – we have to make some modifications to our optical bench because of Sony’s electromagnetic focusing.) By the end of August, we expect to have somewhere north of 75 different models tested and scored. It will be useful when you’re considering purchasing a given lens and want to know how different your copy is likely to be than the one you read the review of. But I think there will be some interesting general questions, too.
- Do some brands have more variation than other brands?
- Do more expensive lenses really have less variance than less expensive ones?
- Do lenses designed 20 years ago have more variance than newer lenses? Or do newer, more complex designs have more variance?
- Do lenses with image stabilization have more variance than lenses that don’t?
Before you start guessing in the comments, I should tell you we’ve completed enough testing that I’ve got pretty good ideas of what these answers will be. And no, I’m not going to share until we have all the data collected and tabulated. But we’ll certainly have that done in a couple of weeks.
Roger Cicala, Aaron Closz, and Brandon Dube
Lensrentals.com
June, 2015
A Request:
Please, please don’t send me a thousand emails asking about this lens or that. This project is moving as fast as I can move it. But I have to ‘borrow’ a $200,000 machine for hours to days to test each lens, I have a busy repair department to run, and I’m trying to not write every single weekend. This blog is my hobby, not my livelihood, and I can’t drop everything to test your favorite lens tomorrow.

90 Comments
Jeff Forbes ·
Wow! Even though these results have little to no effect on me personally, this is fantastic and interesting reading.
Keep it up. There’s literally nobody else doing stuff like this. And while it might cost you some money in opportunity cost and time on equipment, seeing your work inspires confidence in your customers too.
Jay ·
Very interesting. I appreciate that you have a good hobby. Thank you and very much look forward to seeing the data and results in time.
Jay
Jim Maynard ·
Thanks for making this sort of detailed honest analysis available. It may help encourage manufacturers to raise their standards, but then again I am the eternal optimist. Perhaps another plotting scheme might help in the display of lens variation without having to add an (arbitrary) value to each test variable. For example, semi log plots are of value in this regard in some cases.
Rick ·
This should get VERY interesting … can’t wait. But, Roger, at some point I’d be interested in your thoughts on where lens variability comes from. I imagine that it could come from an inherently poor mechanical design which is difficult to adjust, or from a bad optical design which don’t have a clear “sweet spot” (e.g., your example of either sharp center or edges, not both), or from poor or inconsistent factory calibration/adjustment, or poor or inconsistent after factory calibration/adjustment, or ???
I imagine that most of Lens Rental’s lenses have been adjusted by your own service department at some time. If so, it seems to me that your measurements will be independent of the quality of a manufacturer’s own lens calibration/QA. If so, then it might not give us any sense about how paranoid we should be about the quality of a lens we purchase.
Roger Cicala ·
Rick there are a lot of factors. I started to discuss them but this article was already so long. But complexity of design, use of double-sided aspheric elements, image stabilization (especially older versions), ‘simple stack’ (no adjustable elements) design, and a host of other things go into it. We’ll be going into details as we look at more lenses.
Roger
Andre Y ·
Roger, this is an amazing project! Thank you for doing it!
MayaTlab ·
Thanks a zillion times for this !
derek ·
cracking project, I’ll look forward to all future posts in this.
Having played statistics for silicon production I’m with you all the way on the description, and agree that to most people something like average minus one or two sigma performance is what we’re interested in, i.e. this is what we can guarentee to get out of whatever lens.
It would be interesting to see how cheap lenses compare to top of the line ones… i.e. are crop kit lenses really all that bad?
Alan B ·
Roger, I think you guys might have reached a tipping point where you have better numbers about the lens maker’s industrial processes than they have.
Speaking of lens makers, how’s work on that 4.9mm fisheye coming along?
Roger Cicala ·
Alan, the design is done, we’re doing some fine tuning on the mechanicals and will be prototyping fairly soon (fairly soon means a couple of months).
Siegfried ·
Oh, I just graduated from the geek lvl 2.
Weeeeeah!..
P.S.
Roger,
don’t you think it’s worth decreasing the benchmark score resolution? I mean if there’re no significant – read: practical – difference between a lens scored of 5.1 and a lens scored of 5.2 then those decimals are insignificant and should be omitted. You said that ‘a difference of about 0.3 is mathematically significant’ – I’m not sure I fully get it (see above: I’m just lvl 3, sorry), but what about rounding it to the nearest whole or 1/2 number to keep it more practical? “A four-star lens” or “a 5 1/2 star lens” sounds easy yet informative.
Another side-note goes as an idea to separately calculate the variance score for a given lens model. I think it’s rather depictive when comparing different lens designs and manufactures’ QC: like in the 24mm example given above some folks might want to show gratitude to the N brand (I see it on the last graph as grey-violet in the last graph, right?) over the S brand just to disrespect the S’s quality control, though most of the S 24mm lenses gonna out-resolve most of the N 24mm lenses.
Tim ·
First, this is a fantastic project so thank you Roger, Aaron, Brandon, and to Lensrentals.com in general!
Second, a couple of minor suggestions:
1) For the rescaled MTF plots, which double the height on the y-axis, it seems unnecessary and confusing to rescale the y-axis and tick marks to instead go from 0 to 2 in 0.1 increments. Why not scale them from 0 to 1, using 0.05 tick marks, which will be visually the same as your double height plots? This has the additional benefit that the tick mark labels will be in the correct units, with no conversion necessary.
2) One odd thing about your “variance” score is that higher variance scores indicate that there is less observed variance in samples of any given model. This is a little unintuitive. You might consider renaming “variance” to “consistency” instead (or something like that). Alternatively, you could mathematically reverse the “variance” score so that higher numbers indicate higher observed variance. Just don’t do both simultaneously. 😉 One way you might try to reverse the score is by inverting it; this will also give you a different scaling and you may not need the square root anymore or you could adjust the power you use, such as 1/x^2.
Again though, thanks for undertaking this project and sharing with us all!
Roger Cicala ·
Thanks Tim,
I think you’re right – changing the term to ‘consistency score’ would be more intuitive. We’ll probably do that.
Thanks,
Roger
Tim ·
p.s. on a rereading, I realize that the rescaled MTF plots aren’t done so linearly. This is indeed confusing! However, I think having the correct units on the rescaled MTF plots will be beneficial to you (and us), without needing to consider a conversion factor. As Jim Maynard below suggested, perhaps a semilogy plot will work or a similar variation. If you continue to use the same custom scaling, alternatively, you could update the tick mark labels to have the correct values.
JGro ·
I can only chime in here: Roger, really amazing what you and your team are doing here.
It feels a bit like you just announced lens nerd Christmas. 🙂
But not too unlike a kid a few days before Christmas, the lens nerd in me couldn’t help himself but look more closely at your last “teaser” chart. We have the data of the four 24mm lenses, of which the Canon was best with 6.3. So that is the red dot.
I first thought that this would make “reddish” dots Canon, but then this would mean one Canon EF 35mm (well, which one?) the worst of the bunch, and another the best (if the orange at ~6.6 is still reddish enough to be Canon that is…). Naaah…
Light blue would be Rokinon (where the 14mm 2.8 is then about as bad as the 24mm), cyan would be Zeiss (21mm and 28mm). Anyway, I couldn’t match any other dot to Sigma (yellowish at 24mm with a score of 4.9) and I am not so much interested in Nikon, so that is where I stopped.
What I am interested to know: do you already have an idea of how you represent the copy varition of Zooms? You could just do one more step of averaging, but that would say very little (are bad copies bad across the board, or just bad on one end?)
And since we are already talking about Christmas: Is there any chance we might see a comparison of the three 150-600mm zooms any time soon? Maybe compared to the (80/100)-400 of the system manufacturers?
Roger Cicala ·
JGro,
The dots were random color assignments I’m afraid, although obviously some lenses can be identified. We will probably treat zooms as three primes, measured at each end and in the center. Until we gather that data I’m not sure how we’ll present. I suspect we’ll find variation differs at different locations so it may require 3 graphs per zoom, or we may come up with something more elegant. But we have to gather data first to figure that out.
150-600s are going to be back burnered, I’m afraid. They have to be done with Imatest, with a teardown and setup between each lens – basically 4 test runs is a full day and just a 600mm comparison will take most of a week. It will probably have to wait until after busy season.
Roger
F.M. ·
I don’t want to make you lose your time reading the same in a hundred posts so I’ll resume: 1K thanks. You just contribute to improve the world directly and indirectly.
Just a few time ago I was wondering a thing about sample variation and thinking I’d like to ask it to you one day, so this is a perfect timing:
Are aspects like focus shift and geometric distortion subject to sample variation too? I mean, in a perceptible amount such as in sharpness variation?
Thanks again
Goran ·
Ingenious! I’ll be following this closely. Very very interesting. Can’t wait to find out what lenses are hidden in that 35mm column, especially that yellow dot and if it holds its ground. Thank you so much for putting this together!
Frank Kolwicz ·
Roger,
This kind of reporting makes me feel sad that I don’t have more stuff I want to rent!
Ron ·
I don’t really have a problem with the scale MTF values since it is the same for all lenses. I find I don’t even look at the numbers and it helps me quickly eyeball between lenses to see how each generally performs at a particular lp/mm measurement.
My question is when will we be able to send in our own ‘suspect’ lenses, have them measured for comparison against the your averages, with the option to bring them (hopefully) back into the normal range? 🙂 Perhaps the servicing aspect may not be possible for all lenses due to how they’re designed, assembled, how complex they are, etc… But at the least, just being able to get a measurement would give an indication of where the lens stands. A ‘testing certificate’ could also be beneficial on the second hand market for assuring a potential buyer that a lens truly is a good one, or at least within typical variance.
Roger Cicala ·
Ron, that’s something I plan to set up through OlafOptical. It will have to wait until fall, when the busy summer season is over, but I fully expect it, for prime lenses at least, this year.
AJ ·
Excellent, thank you Roger for the current blog and in anticipation of future updates.
Even more reason for LensRentals to be on the top of the list as a ‘must read’ when I’m considering the purchase of a new lens.
Nice to have an alternative to those who refer to the English as “Silly bed-wetting types” 🙂
derek ·
Roger, one thought
Do you buy all your lenses in one big batch or several smaller batches over time?
I only ask as with silicon production batch to batch variation can be as much as unit to unit variation within a batch. I once had a batch that was so bad that we only got about 20% yield yet most batches got over 80% final yield.
either way, it’s all good work
Roger Cicala ·
Derek, we buy them in smaller batches (5-20 copies) throughout the year. And we’ve definitely seen the effects you talk about. There was a batch of 300 f/4 IS lenses that the AF motor failed on every one. Another batch of 17-55s that had IS units go out, etc.
Tony ·
It’s a pity that testing long focus lenses is impractical because the consistency of “Phase-Fresnel” lenses would be of particular interest.
Your test of one example was much worse than Nikon’s theoretical MTF results lead to expect, and it would be good to know if this is a manufacturing tolerance issue.
John D ·
Thanks Roger. Do zooms and primes have a similar variance range?
Roger Cicala ·
John D, zooms have much greater variance, although the slower apertures masks some of it a bit. But you can’t overcome the complexity of zoom groups and the increased movement of various lens elements.
Dan Deakin ·
Are you going to test the variance on lenses as they were when they shipped from the manufacturer (perhaps more relavent for most consumers), or after they been checked / tuned by your staff?
Roger Cicala ·
Dan, our protocol is that all new lenses are checked by our intake staff and any unacceptable ones are returned, which is about 2% of lenses. This is roughly equivalent to someone testing the lens very carefully at home. The ones we test optically don’t include those, so you could probably think of it as the sample variation of acceptable, non defective copies.
Aaron ·
For a 98% confidence interval, shouldn’t it be -2.8 sd above and below the mean? Using R:
> qt(0.01, 10)
[1] -2.763769
Tuco ·
You’re threatening the tedious, age-old “Tuco at the Gun Shop*” process. (https://www.youtube.com/watch?v=meP_Ufwj-FY)
You should be able to show real-world performance and manufacturing consistency, hopefully leading/pushing vendors to respond with better products. Good stuff. This will be more useful than web reviews and DxO.
But, don’t think for a moment that it can replace Eli Wallach.
JulianH ·
The testing procedure seems reasonable to me and the results are very interesting already. Thanks for sharing so much about your methods, and of course thanks for wrinting this blog at all.
I’m wondering if it wouldn’t be more informative if the variation plots would show the median sharpness across all lenses, not the mean sharpness. That would give a better representation of the sharpness that one would expect from a random lens of that type and not be as sensitive to single outlier values (e.g. one of ten copies being far better or worse than the rest).
One other small thing: I find the terminology to be slightly confusing, especially the use of “variance (score)” as something that increases with decreasing variance. I understand that you want such a value because what the average person expects from a score is that a higher value is better. It’s slightly more confusing because, mathematically, the variance is the standard deviation squared, while your variance is the square root of the standard deviation. Or, actually, something like sqrt(mtf^2/(8*SD) * (1-mtf/2.25)). Unless I am misinterpreting your code, which is very possible.
Anyway, cheers, I’m looking forward to more results, no matter what they’re called. 🙂
Tony ·
I have a couple of comments on the data workup. First off, I was very pleased to see this: “So we made the Variation number relative to the lens’ measured MTF, rather than an absolute variation.” I think that helps keep the presentation more intuitive than you’d get with absolute numbers. 10% vs 20% probably appears much more different than 89% vs 99%.
But the next sentence had me scratching my head: “We simulated the score for lenses of increasingly high resolution and saw the score would rise exponentially, so we take the square root of it to make it close to linear.” I’m not sure that making things appear more linear is automatically and inherently a good thing. You might have an excellent technical reason why that is the right way to look at things but that wasn’t explained. I fear that this might be a step away from complete transparency of the meaning of the numbers. I’ll vote for traceability over beauty.
Like Julian, I prefer medians as opposed to averages. Half will be better, and half will be worse. Once again this would keep things intuitive, as in: “I have a coin-toss chance of getting a worse lens that that”.
Seth ·
JulianH: I think mean vs median is mostly irrelevant in this case – there should be no outliers since Roger and the team are pre-screening lenses for issues before doing the optical test and ingesting the data. If it’s good enough to pass pre-screen then it should be considered a representative sample.
Brandon ·
Ron, Tim,
The only way to separate the various spatial frequencies is to, well, separate them. A semilog plot or anything like that wouldn’t be particularly helpful – the issue is that for both the very variable lenses and the very high resolution lenses, the lower range of 20lp/mm may overlap with the upper range of 30lp/mm, for example. Short of actually moving the data (and re-scaling the axis to keep it visible) we do not know of a way to make the plots more readable.
Regards,
Brandon
Brandon ·
Tony,
The reason we try to force the score to be linear is to prevent the excellent lenses from “running away” so to speak. On the focal length plot you can see two 100mm lenses that are head-and-shoulders above the rest. Without using a square root adjustment, their scores would be higher than 20 if we scaled the score to make the 24mm lenses score about as well as they do now numerically.
The lenses are better, but they aren’t 3x better, and if there are lenses a little better than those they may score 40 – likewise those aren’t 6x better, and so on.
It also helps to compare lenses – here we can say that a difference of 1 is always significant. Without the square root, it isn’t significant for very poor scoring lenses, and it isn’t significant for very well scoring lenses.
Regards,
Brandon
Brandon ·
F.M.,
All aspects of the lenses vary to some degree, how much it matters is up to the user to decide.
Distortion won’t change much unless the lenses are assembled very poorly – with prototypes of a particular lens I tested for a different project I saw a 1.63-1.87% barrel distortion range across 13 copies. Lenses that have much higher distortion shouldn’t be more sensitive to manufacturing error, though the point of inflection in lenses with moustache distortion can shift around a little bit.
Focus shift is complicated – the quick answer is “yes, it can vary” – how much I don’t know. The requirement is more or less that a lens element be spaced forward/backward incorrectly instead of shifted to the side a bit, tilted, etc. Possible? Absolutely. But it’s less likely than a shift side-to-side or a tilt.
If you would like to talk about it in more detail, feel free to email me at brandondube@gmail.com
Regards,
Brandon
David Ruether ·
Thanks!!! I’ve “touted” this lens sample variation “thing” since I first posted my “Subjective Lens Evaluations (Mostly Nikkors)” on my website beginning in 1996, and it is now at:
http://www.david-ruether-photography.com/slemn.html
Being a lens sharpness nut, and having had the opportunity to go through many lenses (both owned and borrowed) over the oh-so-many years, I collected a couple of times rather nice groups of lenses, and currently I’m working on a good set of MFT lenses, with a “simpler” piece on those here:
http://www.david-ruether-photography.com/MFT-Lenses.htm
But, unlike you, my methods were necessarily more “subjective”, with an eye used to evaluate/compare thousands of images over time. For reasons (possibly) explained in the above articles, I used distant detailed landscapes rather than test charts for my evaluations, but I like your method, too!;-) Thanks again for doing this!
–David Ruether
Peter Honka ·
do you also test sony FE lenses?
i hear and read horrible things about sony lenses.
i would really love to see results for the sony E mount.
Roger Cicala ·
Peter, we have to create an electronically wired mount to connect the lens to a camera or power supply to maintain focus. We’re prototyping one, but it’s difficult.
Andrew ·
I love this. Can I make a suggestion, about presentation? Given the way our visual system works, it would be much easier to compare pairs of the wonderful MTF + variation graphs if you flipped one of them horizontally (mirror image, left to right). In other words, have the “center” numbers in the middle (between the the two graphs), and the “edge” numbers on the outside. I tried it quickly, and it makes it much easier to line up the graphs and see whether lens of one type that fall within the range of variability are generally better or worse than those of the other. Does that make sense?
Carl Spencer ·
Roger do you plan to also include the results of the Angenieux 25mm f/0.95 if you come across a more copies of the lens?
Fil ·
Roger et Al., what you’ve started here is one extremely valuable service to photographers as well as manufacturers! Expect to be epically misunderstood by both sides, for daring to shatter many a belief and dream (not to mention advertisement!). In the meantime, we’ll go on using what we have, and make the best of it. From the first Box Brownie thru the latest Yunamit… all cameras were good if used within their specific abilities. It was always photographers that were the greatest variation.
Great work, this. Looking forward to the sequels.
MayaTlab ·
Peter Honka,
I suppose Lensrentals’ people will give you a much more satisfying answer than mine, but from what I gather they’re hard to test since many FE (and m43 I suppose) lenses use an autofocus mechanism that leaves autofocusing elements loose when the camera isn’t powered on – meaning that it’s hard to keep them in the right place for testing.
Feng Chun ·
Absolutely loving this!
Florent ·
Roger, I always find your posts very interesting, well written and always with the right touch of humor.
What you’re going to carry on, which is really a study on lens variations, is gonna be of tremendous help! As far as I can tell, no one has ever done such a thing and I’m looking forward to reading the results.
I think we cannot say it enough: thank a lot for all the efforts you put on your different testing procedures and this blog of course 🙂
william ·
A tangential question to this subject. There is variation between lenses, and between the same lens on different bodies. Can there be a variation between the same lens on the same body after unmounting and remounting the lens? You stated previously a few microns difference can affect lens performance and I surmise this could occur at the mounting point? I ask as my PDAF microadjustment values seem to change intermittently.
JohnL ·
I mentioned this in the comments on the IR article about this (excellent) piece and will also mention it here – it would be interesting at some point to see if expensive Cinema lenses use some of that extra money on better alignment.
Also new results vs. results after a chunk of use would be interesting. I’d rather have a lens that stays the way it was over one that’s stellar for the first year and not quite so good afterwards.
Matthias Welwarsky ·
You totally forgot the closing ‘>’ at the and of the bracket
o_O
Wally ·
Do you see a big advantage of your variance number over just using the Coefficient of Variation on the mean values. Or in your code:
VarianceNumber = 100*(Tan30SD_Average/T3Mean) with of course code to select which set had the higher number Tan. or Sag.
It would have the advantage of larger numbers being more variable and still scales with higher resolution lenses. For instance a 0.8 MTF lens with a 0.1 SD would end up 12.5 and a 0.6 MTF lens with a SD of 0.1 would be 16.6
Brandon ·
JohnL,
We do plan on looking at cinema lenses at some point but not immediately – there are many photo lenses to look at first. Some cinema lenses are not the same as their photo counterparts, for example the canon cinema 50mm and there is a noticeable difference on OLAF in the assembly of the 24mm cine and L versions.
All in due time.
-Brandon
Brandon ·
William,
The flange distance can change with time slightly, the mount will wear down a little, the wavy washers in the mount will wear and loosen, and internal collars and other bits will wear too. For phase detect autofocus, every lens copy has a lookup table of correction values set at the factory to counteract things like focus shift, incorrect mount distance, etc. This is usually what gets adjusted when you send a lens to be fixed for bad focus.
Anyway, yes the mount can change =)
-Brandon
Brandon ·
Wally,
If we used a system like that, we would have to invert and scale still. I think they come out with similar complexity in the end, but a big “feature” of the variance number is that the difference between “5” and “6” is about the same size as the one between “6” and “7” and so forth. This was lost in most of the other systems I tried before I settled on this. We do want to keep some consideration for the absolute variance too. E.g the sigma 24/1.4 being more variable absolutely than the Nikkor 24mm – without the adjustment to discount higher resolving lenses it sits pretty squarely between the canon and the nikon. We felt the number should reflect both absolute and relative variance to some degree.
Regards,
Brandon
Wally ·
Without having access to all the data, it does make seeing how all the number scale relative to each other difficult. However, I would suggest that when calculating the standard deviation of the MTF values you should be doing it on all the original numbers for a given frequency value and not on any of the consolidated set of numbers. In the case of the mean it does not matter but by averaging the deviations over several steps it does result in a significantly different final number. Perhaps you already are, I of course do not know what MultiCopySDTan30 is, is it the full set of data or the values used in the graph?
Brandon ·
Wally,
the preprocessing so to speak works as follows:
4 quadrants and single-copy average read by matlab, single-copy plots produced. Xlsx file written with 4 quadrants and average.
Matlab script copies all single copies into a Master sheet for that copy. Master sheet takes the standard deviation (as well as some other information) of the individual copy’s averages – not their rotations.
Averaging the individual rotations does not work for lenses that have built in petal hoods, such as the Canon 14mm f/2.8, Zeiss 15mm f/2.8, Rokinon 14mm f/2.8, etc. You get results like this: https://www.dropbox.com/s/o39wcsv7vvpwm94/MTF_Rotations.pdf?dl=0 where some rotations are clipped, others are not.
Additionally, we are looking at the variation between copies with the variance number. If we take the standard deviation of the rotations we are looking at the variance between as well as inside copies. We are recording the numbers you are suggesting taking in excel but we aren’t doing anything with that information yet.
Regards,
Brandon
Curby ·
First, thanks for taking the time and effort to do this. I’ve commented before that you’re uniquely positioned to provide this useful analysis, and I’m glad that you have some time to embark upon the journey!
Thanks for applying the scientific method where possible (sharing your techniques, being open to process improvements, etc.). Other companies (like the one that rhymes with GXOBark) lack openness, which as you say results in constant bickering about bias and validity. Pretty much every other reviewer only works with a single lens, and we all know what science thinks of an n of 1.
Also, Brandon needs a fancy lensrental Employee (or lensrental Intern?) tag when he comments.
Also, it still says copyright 2012 in the footer of the webpage.
Also, I don’t think I’ve said you’re awesome yet. You’re awesome.
David Eichler ·
This is very useful. Thank you. It is surprising to me how many photographers, even many professional ones, do not realize that there can be significant copy-to-copy variations among lenses. I am also glad to hear that you test the lenses you rent and sell, which I believe is not something that your competitors (at least not all of them) do. I once rented a 17mm Ts-e Canon lens from one of your competitors, a lens design I know that performs extremely well, and it was absolute garbage. I hope this kind of testing will encourage manufacturers and rental companies to enhance their quality-control procedures. You are in an ideal position to do this since you have access to so many copies of the same lenses.
Leo ·
These are very useful and practical results. However, the results would be really practical, when the lens manufactures with poor manufacturing and QA process will loose the sale. The result can be unexpectedly higher lens prices at least initially. Most of the CZ lenses should be very good based on their prices, however at the end the king may have no cloth.
Leo
Charles ·
“We simulated the score for lenses of increasingly high resolution and saw the score would rise exponentially, so we take the square root of it to make it close to linear.”
Without knowing what the data looked like, it sounds like a square root may not be the best correction (especially if it is actually exponential). Perhaps find which of an exponential function and a low degree polynomial function best fits your simulated data and use its inverse to correct your data.
Randy ·
In the good old days, there were the engraved Linhof and Sinar lenses which were a tacit admission that expensive lenses do vary or if you prefer, that Zeiss, Schneider and Rodenstock’s quality control wasn’t demanding enough.
I suspect you’ll find that most of the more expensive stuff doesn’t vary enough to worry about but the bargains, like Rokinon will be all over the place. As they say, one person swears by a lens…the other at it, and they’re both right.
Should be a heck of a lot more interesting than reading some DxO report.
Matt ·
Do you tend to source your lenses all in on go, or buy from a range of sources and over time? I’m interested if you see much variation between manufacturing batches or factories.
Brandon ·
Charles,
We looked at several options – the best two were taking the log or taking the square root. With the log we would have to multiply by a larger constant, but the effect is similar enough with sqrt that it works out okay.
Here’s an example of the simulation – https://dl.dropboxusercontent.com/u/8482172/variancescorecorection.png
The log correction is perhaps better, but the lens must be truly exceptionally good to score high enough that things aren’t linear (higher than 20 with the final scaling choice). Note the vertical log axis.
-Brandon
Madwyn ·
I’ve had a bad copy of SONY Zeiss Distagon 24/2, unfortunately SONY’s engineers with trained eyes and equipments can’t tell the tilted glasses.
Since then I realised the importance of copy quality.
I’m really glad to see you are doing this. Fanboys will love you and your results will be quoted a lot.
NightPhotographer ·
Thanks for the time and effort you put into this. For a long while, I was looking for such data base but, apparently, what you are doing is unprecedented. I am not asking for including a specific lens in your test, as you have warned readers not to do so but I think it might not be a bad idea to include some semi affordable Zeiss lenses such as 135 APO in your test to show if the high price that they ask for their lenses is justified.
Cheers
Brandon ·
Nightphotographer,
We are looking to include *every* lens we can in the database. Already discontinued lenses are out of the question, many low price lenses are difficult (e.g 50mm f/1.8 STM) because of low stock, and rare lenses like the Schneider tilt-shifts and leicas are difficult, but all mainstream lenses we can test will be done.
We have already completed almost the entire ZE line. The 135 requires the larger collimator so it is backburnered for now.
As of this very moment, I have tested 385 copies across 68 models for the database. I will pass 400 copies today, and there is a new model or two in the latest group of lenses I have pulled. We’re getting there, it just takes time.
Regards,
Brandon
Chris ·
All I’m concerned about is the Canon 16-35mm F4 IS cause that’s the lens I own. =) I imagine Canons newer lenses are more consistent than older ones. Though it is strange DXOMark rates the 16-35 F4 IS equal to the 17-40 in sharpness. Some of its sharpness maps even suggest the 17-40 edges the 16-35 out in some areas. I don’t get it.
Phillip Reeve ·
Thanks for all your work!
And I totally think you should also rent legacy lenses from the 70’s and 80’s. What could go wrong? 😀 You wouldn’t even have to worry about electromagnificient focusing when generating all the information to still my curiousity.
jankap ·
Wouldn´t it be a good idea to offer this testing to us users? Imagine one pays a fee, send his lens to you and become it back after some (not so long) time with a report.
The report would tell us: a good buy, use it and (do not) wonder or put your lens into the bin.
A nice study, by the way.
Jan
Anton Berlin ·
DXO doesn’t actually test lenses and sensors. They calculate their scores.
“The DxOMark Score corresponds to an average of the optimal quantity of information that the camera can capture for each focal.The quantity of information is calculated for each focal length/aperture combination, and the highest values for each focal are weighted to compute the DxOMark Score”
This is why DXO has such wildly off numbers when comparing the FE55 across the Sony A7r and NEX7
BigEater ·
I’m sure that camera manufacturers think you’re the Devil himself come to torment them, but you are doing the world a great service. Keep it up. Thanks….
BigEater ·
And by the way, why not just tape a sheet from the Commercial Appeal to the wall and shoot that?
Roger Cicala ·
BigEater, that might cause me to accidentally read a page from the Comical Appeal.
Roger
F.M. ·
Brandon,
(about the focus shift question)
Thank you very much for your answer.
I remember getting a bit puzzled with some reviews of the 50 1.4 Art stating different results about these characteristics and wondering if it would be due to some strange sample variation (as all reviews stated stunning sharpness), but I understand that this would be very unlikely?
Thanks again
Brandon ·
F.M,
Manufactures update the firmware for lenses periodically, especially third parties. Sigma and Tamron are currently updating their lenses to function on the 5Ds/5Dsr for example. Each body has a lookup table stored in it to “fix” autofocus. It factors in the lens model, focusing distance and the aperture and gives a small correction value for AF. Third parties have to report their lenses as a certain first party lens for this to work right, and the codes for the lenses change with every camera, so things get tricky.
Physical variation in terms of focus shift is definitely possible, but I do doubt it since the 50mm Art is the lowest variance 50mm-ish lens I have tested yet, and there aren’t many left I haven’t completed.
Regards,
Brandon
Lester ·
Great to see serious work on copy variation. Two comments. One is to note the common rule of statistical thumb — if more than two standard errors separates data points, they may be said to be “significantly” different. So it is common in graphs to illustrate error bars or error bands as plus and minus one standard error, so if there is no overlap it is visually obvious that the difference is “significant”. Two is to note that, in a Gaussian distribution, plus and minus 1.5 standard deviations covers around 87% and not 98% of the data (wry smile).
Blame ·
Not sure about your using 4 rotations. (0, 45, 90, and 135 degrees). Two of them will extend beyond the limits of a standard 24x36mm full frame sensor.
This will penalize manufacturers who ether put a rectangular mask to the back of the lens (presumably for a little extra flair control) or carefully rotate glass elements to push the lowest resolution to the unused area at top and bottom.
Have you tried a comparison of diagonal against vertical rotation results?
Roger Cicala ·
Biame, we have. It’s obvious when a rotation cust a corner (it hasn’t yet for internal baffles, but does for some permanent hoods) and we drop those numbers – which are always only 20mm at one or in one case two rotations.
Blame ·
Rodger. Glad to hear it. It was looking at this blur plot for a top quality Zeiss lens that made me suspect that the worst blur could be deliberately shoved to top & bottom where it wouldn’t matter.
http://slrgear.com/reviews/zproducts/sony135f18z/ff/tloader.htm
Sombody ·
Brandon (or LR team): One thing that I remember from statistics is that averaging averages is a bad idea. Specifically, averaging the four runs of one lens into a single MTF chart and then averaging those to calculate the baseline and sigmas. Would it be more accurate to treat each measurement run (as your get four sets from each lens) independently instead of averaging them together? If you’re talking about one lens and provide the chart based off the average of the four, that might keep things simple, but when comparing against all other lens, I’m not so sure. Ideas?
Roger Cicala ·
Sombody, there’s just a point, with what’s approaching and will soon exceed 100,000 data points, that we just have to start compressing and averaging things to keep it anywhere like reasonably manageable. Not saying the method we chose is the best, just saying we had to do something and this seemed practical. We knew going in we weren’t going to be able to do a scientifically valid 95% confidence interval on what is significantly skewed nonparametric data. That would require resources that we’re a few million dollars short of having.
But compared to the “0” amount of data that existed before we started, we still feel this is worthwhile. Hopefully somebody someday will come behind us and build on this.
Chris Newman ·
This is excellent information for those of us wanting to choose the most suitable lenses, far more dependable than the single-copy test results from other sources, although it would be great if equivalent data for the lenses at their sharpest apertures was available. I’m delighted that similar data on zoom lenses seems to be following. I’m particularly grateful to LensRental for generating this information, as these studies seem peripheral to the core business of distributing and maintaining lenses. Most test data comes from organizations that earn their bread and butter from publicising their results.
I feel uneasy quibbling with work I appreciate so much, but I was surprised to read “we calculated the (‘consistency score’) just for the 30 line pair per mm (green area in the graphs) variance, since that is closest to the Nyquist frequency of 24MP-class full-frame sensors.” This is only 720 line pairs on a picture height of 4000 pixel rows. In contrast http://www.imatest.com/docs/glossary/ states “Nyquist frequency fN = 1/(2 * pixel spacing) = 0.5 cycles/pixel.” and http://bobatkins.com/photography/digital/eos20d.html showed the system response for the Canon 20D (8 MPx, equivalent to about 20 MPx full frame), with EF 50mm f/1.8 lens at f/11, as falling to 0.5 at 50 cycles per mm, and quotes a Nyquist limit for the 20D of around 75 cycles/mm. The review includes similar data for the Canon 10D.
Chris
Brandon ·
Chris,
The Nyquist we refer to here is closest to the “true” or “adjusted” Nyquist of this sensors. The bayer array *immediately* throws away 50% of your spatial resolution, as you need a 2×2 chunk to make a single pixel. From there you have sensor losses, typically in excess of 15%.
-Brandon
Chris Newman ·
Thanks Brandon for the clarification. I thought cameras’ image processors combined the data from each photosite to interpolate the missing colour channels and produce a reasonable approximation of a full-colour pixel for each photosite. But your explanation explains the difference between your value and others for the Nyquist frequency.
Chris
carypt ·
i cannot determine the manufacturers will to work good .
i think the variation-number is confused by the relative mtf-result connection . the number should give information only on the build-quality of the lens ( accuracy in spacing , lenses-cut , glass formula ) and not on resolution .
the variability is because of coincidence of tolerances in build or sloppiness . but yes , design ( quantity of inbuilt lenses ) can increase the tolerance-induced variability , too .
the fact that high-end-lenses are more vulnerable for mtf-variability-impact should not be hidden by a possible quality bonus , whereas the variability still has heavy impact on the lenscopy .
the green 30lines mtf indicator is influenced by the mtf-values-height , it should better have a reciprocal mtf-correlation , or something like that , it should not give credit to good resolution .
well , i dont know how to consider mtf-values fair on variational spread .
i write this because the sigma 24mm 1.4f looks more variant than the nikkor 24mm 1.4f to me , and so i cant follow the variability-number .
sry for bad english , sry too , if i got it wrong .
Samuel H ·
I revisited this, to read the methodology behind the range charts, and I think you got your probability wrong: with a normal distribution, the range of +/- 1.5 standard deviations contains 86.6% of the realizations, not 98% (that would be +/- 3 standard deviations).
Brandon ·
Samuel,
Here is a very very beta chart I wrote the software for at 1am this morning: http://i.imgur.com/Dlrr5oT.png
I won’t tell you what lens it is, but the Y axis it the # of samples and the x axis is number of standard deviations from the mean. There’s a histogram and moving average fit curve. Each of the plots is one of the five spatial frequencies measured.
You’ll notice that it’s bimodal and there’s not really much of a normal distribution. In retrospect, assigning something like “90% of samples fall within this range” was a little silly since it seems the lenses are not at all statistically “normal.”
Best regards,
Brandon
Adam Fo ·
The German magazine ‘Color Foto’ have been testing lens centering for years. Leica lenses made in Germany have the most constantly high scores for this going back to 1996 (the earliest issue I have.) So, although they don’t test multiple copies,you see pattens emerge.
Canon (non-L) and Nikon AF wide angles from 1996 to around 2007 or so, can be dreadful.
Leonid Xaxax ·
What is a distance from a matrix to a target?
How many lines per mm should allow a lens for Sony a7rii?
Scott Kennelly ·
I’m really surprised nobody has posted a comment here. I wanted to say thank you for posting this. It’s very interesting stuff. I know others find it interesting too, because I cam across a link to this page in a post on a forum somewhere.
Michael Clark ·
When the blog was moved from one platform to another several years ago comments made using the old platform were lost.