I’ve mentioned in some other posts that our optical tools can do a lot more than just test a lens’ MTF. For most of the last two years, though, testing MTF is what we’ve been doing. We may not seem all that busy, but we’ve assembled what is probably the world’s largest database of current camera lenses; approximately 1,500,000 measurements on 1750 copies of 330 different lenses from 15 manufacturers.
Recently, though, we’ve started exploring some of the other testing available to us. Partly that’s because we’re geeks and like doing this stuff, and partly because we’re looking for more and better ways to test lenses. One of the things we’ve been doing a lot lately is looking at field-of-focus curves. There is a LOT of information in field-of-focus MTF testing, enough that makes it worth doing them even though each takes a lot longer than a standard MTF test.
This is an introductory article – one where we’re showing you what we’re finding out as we’re finding it out. If you already understand all about field vs focus graphs you won’t get much here. But if you don’t, this should be a nice, painless introduction to some of the new testing we’re doing.
So What Are Those Amazingly Gorgeous Graphs, Anyway?
Officially, they’re called an MTF vs Field vs Focus graph and gorgeous part comes from software written by uber interns Markus and Brandon. They’re fairly intuitive, but also have a lot more information in them than you might realize so let’s talk about what they are and how they are made.
The Field
Let’s start with a regular MTF graph. Many of you have seen them. Many of you don’t really understand them, but that’s OK. The MTF vs Field vs Focus graph are actually simpler in many ways and you don’t really need to speak MTF to appreciate them. So read along for a second.
Notice the regular MTF graph above goes from 0mm of image height to 20mm along the horizontal axis. Image height isn’t a good word for us photographers. It really should read ‘distance from center toward the side of the sensor’. The center is “0”, one edge is “20”.
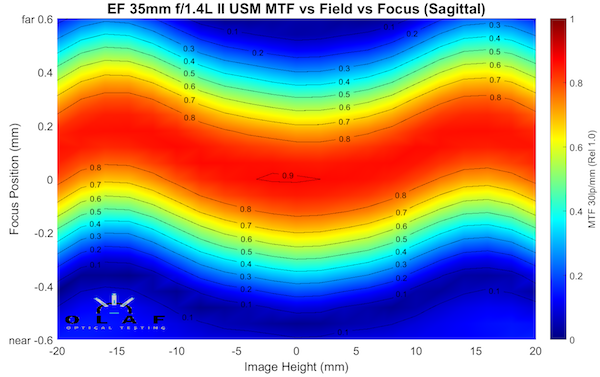
The raw data the optical bench gives us actually goes from -20mm to +20mm, that is from one side of the sensor to the other, like the graph below. To make that graph above, we actually average all the measurements from both sides of center and and plot them as though it was showing one side (from center to edge). The actual information that comes from the optical bench puts the center in the middle and shows both sides, like this.
So, the takeaway here is “Field” is from one side of the camera sensor to the other. The field is also called ‘Image Height’ by Geeks who measure stuff in labs, so in the graphs ‘field’ or ‘image height’ both mean distance away from the center of the image.
Focus
When we make an MTF curve like those above, we set the lens to infinity focus and lock the focus ring in that position. (Locked is a technical term meaning ‘stuck some gaffer tape on the focus ring’.) The Optical bench then fine-tunes focus, determining the exact focus position at which the MTF is highest at the center of the lens. It’s very accurate, measuring focus in 5 micron increments. (In case you don’t know, the infinity mark on a photo lens means ‘around infinity’. On a Cinema lens it should be accurate, but still might not be 5 microns of focus accurate.) Once the optical bench has determined the best focus, it measures the MTF from one side of the lens to the other, remaining at that ‘best for the center of the lens’ focus position.
In photographic terms, if you used center-point autofocus on a fence at right angles to you, the MTF curve would show you how sharp that fence would be from one side of the image to the other. People might look at that photograph, though, and say “Halfway from center, the grass in front of the fence is in better focus than the fence, and at the edges the grass behind the fence is in better focus.” That’s commonly called field curvature, but probably better described as plane-of-focus curvature.
Another related comment is “If I used the left sided autofocus point, wouldn’t the MTF (OK, they’d say sharpness, but I’m being all technical here) be better for that part of the fence? The answer is probably yes. But if you do that, probably the center would not be as sharp. Because the best focus at that part of the fence may well not be the best focus for the center of the fence.
When we do a Field vs Focus the optical bench is set differently. At each point, it measures and records the MTF over-and-over as the focus is slowly changed through an 600 micron range. (These graphs are labeled from 0.6 to -0.6, which is incorrect, it should be 0.3, but I’m not going to remake all the graphs since it’s not really important for this article.) At each focus point the MTF is recorded. So the vertical axis of the graph of MTF vs focus position. The 0,0 point in the center of the graph is best center focus. As you go from left to right across the image, you can see that the best focus can be in front of, or behind, where the best focus point at the center of the image.
This is why MTF vs. Field vs. Focus is in many ways a better test than just MTF. For every point across the image, it shows you where the best focus is located and what the best possible MTF is at that location.
We’re measuring our curves at f/5.6 so the focus range is rather thick. This is mostly because it smooths out the graphs and shows the shape of the field well. Wide open, many lenses get so soft off axis that it’s harder to see the shape of the field. And f/5.6 gives us a ‘common aperture’ that all lenses can reach so the graphs will be similar.
The MTF Part
In these graphs, MTF is represented as a color, with red as the highest (sharpest) and blue as the lowest. There’s a key on the right side and some outlines around each area on the graph showing you the MTF to the nearest 0.1. So you know the red area in the graph above is an MTF of > 0.8 for example, orange is 0.7 to 0.8, etc.
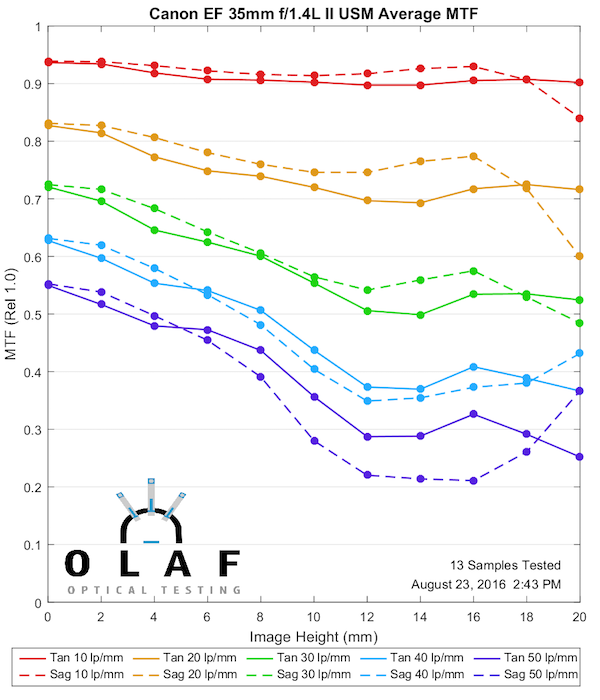
We lose some MTF information, though, compared to a standard MTF graph. It’s a fair trade for the new information we get, but still there is some loss. One thing you may have noticed in the graph above, the curves are done at 30 lp/mm. The standard MTF graph shows us MTF at multiple frequencies, but for this graph we have to chose one of those. The curves are very, very similar at all frequencies, though, so this isn’t too much of a loss.
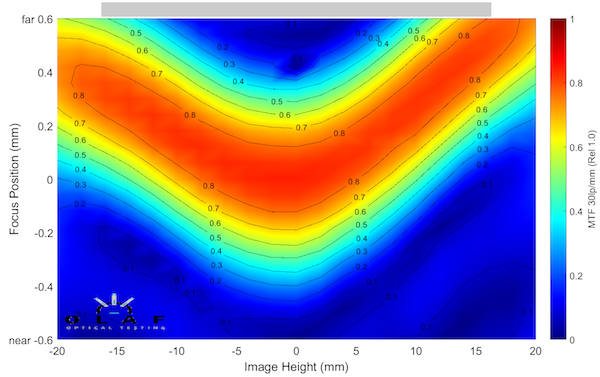
One other thing some of you probably noticed; the graph above was for just the sagittal component of the MTF. We can’t plot both the sagittal and tangential curves on this graph like we can a regular MTF graph. (If you don’t understand sagittal, tangential, and astigmatism very well, I recommend this excellent article by Paul van Walree). So we have to make two graphs for each lens; one sagittal and one tangential.
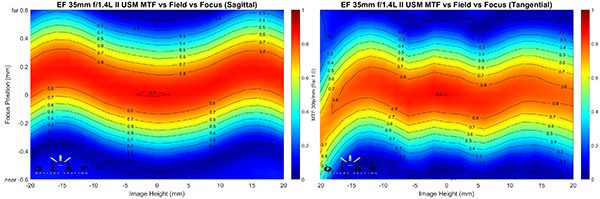
The example above is for an individual copy of the Canon 35mm f/1.4 Mk II lens and it shows a couple of important things. First, the curvature of the sagittal and tangential planes are different: the sagittal plane has a wide M-shaped curve, while the tangential is (overall) rather flat. So there is some astigmatism in this lens, although not much. Second, the tangential curve isn’t quite symmetrical, it’s a little different on the left than the right. This is a copy variation effect. This copy is a bit decentered, although not enough that you can tell it on anything other than an optical bench.
So How is This Useful?
Actually, I’m going to take up several blog posts talking about we might use these. But lets start with one: knowing a lens’ field of focus curve can be helpful when ‘choosing’ or ‘using’. Let’s say I’m considering buying a 50mm wide-aperture prime lens. Or let’s say I already have one and want to get the very most out of it.
Knowing what the field of focus looks like can help me choose the best 50mm for the kind of photography we do. If I already have one, it can help us frame a shot for the strength of my lens. Not many of you have considered it, because you don’t have a handy reference for field-of-focus curves. (Some of the best photographers figure it out when they add a new lens to their bag, though.)
One important thing to note: When our field of focus curve is moving towards the top of the graph, the focus curve of your image is moving towards the camera. Think of the camera as sitting a couple of inches above the graph and focused down toward the center of the graph. The field of best focus in the graph would then look like the field of focus would from the camera. I’ll give you an example later.
Let’s look at the field curvatures for some 50mm lenses. I’ll make a few comments as we go and then some overall comments after.
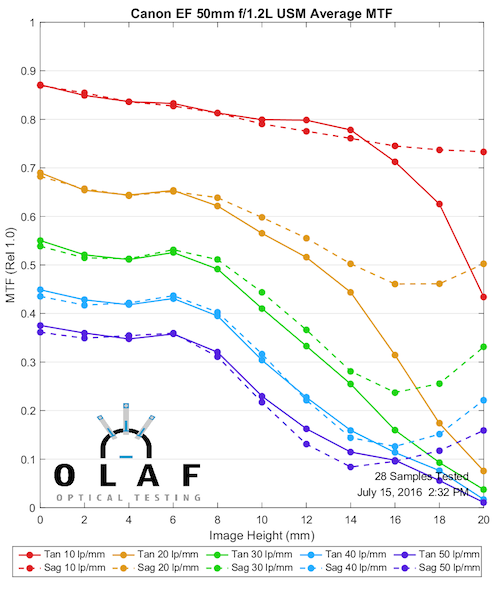
Canon 50mm f/1.2
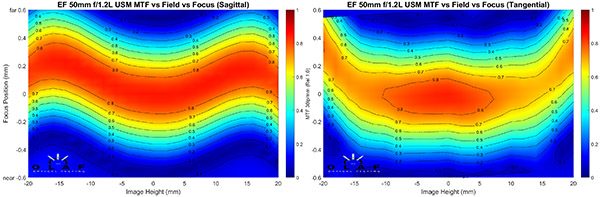
One thing that should be apparent is the tangential field for this lens is generally not as sharp as the sagittal field, even stopped down to f/5.6. Another is that the fields are entirely different shapes (they are for most lenses). It should be intuitive that out near the edges this lens will be astigmatic. Well, maybe not at f/16, but did you actually buy a wide-aperture prime to shoot at f/16? The field curve is a good demonstration of why the MTF curve has marked astigmatism at the edges.
Canon 50mm f/1.4
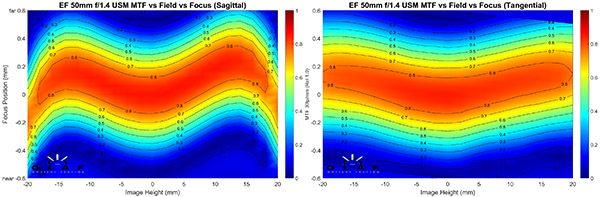
The inexpensive 50mm Canon has a more extreme sagittal “M” than the f/1.2 lens did, but the tangential field is quite flat. We would expect this lens to have some astigmatism in the 10mm to 15mm off axis area (the middle third of the image) even stopped down, but that it would have less astigmatism near the edge. Also you can see that the tangential and sagittal fields are more evenly sharp in this lens.
And I guess this is a good example of why you don’t spend an extra thousand dollars for f/1.2 if you plan to shoot at f/5.6.
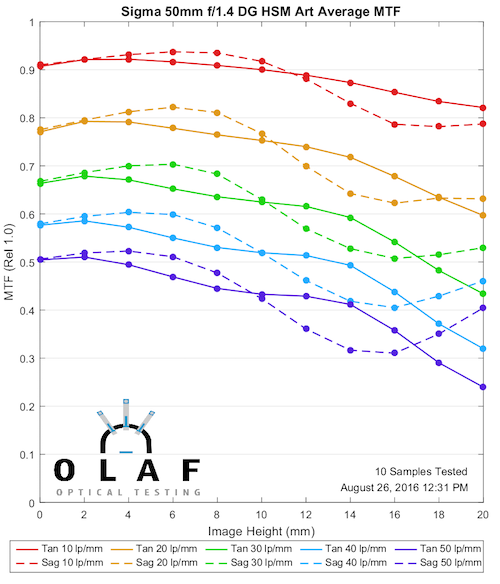
Sigma 50mm f/1.4 Art
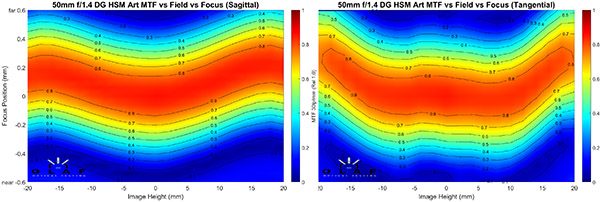
The Sigma has a very slight M curve in the sagittal field, and a fair U curve in the tangential field. The designer has actually used this effect to cross the astigmatisms back-and-forth so there’s never a lot of astigmatism, as you can see on the standard MTF curve.
Also notice how the sharpness (at f/5.6 remember) stays good out to the very edge of the image. One point that is apparent here, and useful to know if you’re shooting landscapes and architecture: in the middle third of the image (from about 10mm to 15mm from the center of the sensor) both fields are curving in the same direction. So a two dimensional subject, like the fence I talked about above, or the test chart you’re shooting in the basement is going to focus in a slightly different plane than the center.
Sony FE 50mm f/1.4 ZA
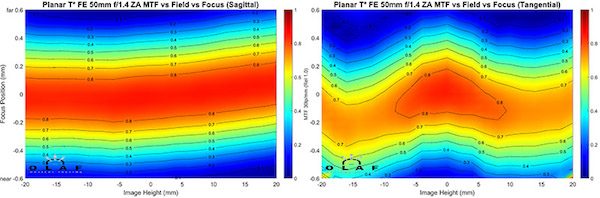
When the Sony Planar T 50mm f/1.4 ZA was first released, people commented that it had a different look than other 50mm lenses they were shooting with. The field curvature shows part of the reason why (and also why this is not just a Zeiss remake). The sagittal plane of the Sony is extremely flat; the most supine of any 50mm lens. The tangential plane has a different curve than the others (and like the Canon 50mm f/1.2 is not quite as sharp as the sagittal plane). This is part of the different ‘look’ of the lens. It also tends to make the field of focus flatter than the other 50mm lenses.
Zeiss 50mm f/2 Makro Planar
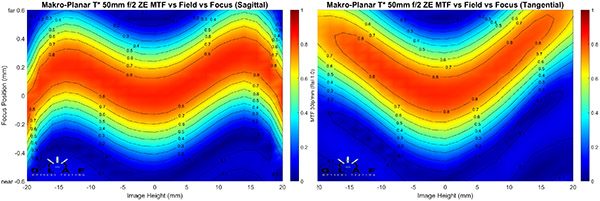
The Zeiss Makro Planar f/2 has a more accentuated curve, with pronounced sagittal “M” and tangential “U” curves. You’ll see in subsequent posts that this sort of a Zeiss look; a lot of their primes have similar curves. Actually if you overlay the two curves in your mind, you realize that out to 15mm (3/4 of the way from center to edge), the curves are almost identical, meaning there’s very little asigmatism until you get in the outer 1/4 of the image.
For those who can’t overlay the curves in their mind, I’ll do it for you. Here’s a simple image where I put the two field curves over each other, then used the Photoshop difference filter. That dark area in the center is where there is virtually no astigmatism.
On the other hand, the curve of that dark area shows how the field of focus curves in your shot, too. Remember, though, this is the field of focus at infinity. This is a Makro lens so it has a much flatter field at close distances. Non-macro lenses usually don’t change their field of focus all that much at closer range.
Zeiss Otus 55mm f/1.4
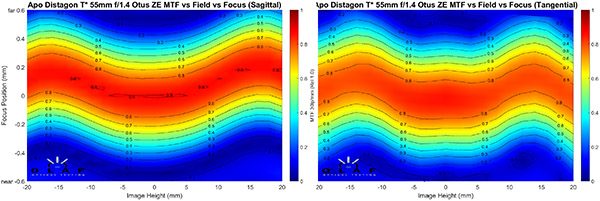
The Otus is a unique lens and I think the field of focus curves show another way that it’s special that the standard MTF chart doesn’t show. Although not exactly the same, it should be readily apparent that the sagittal and tangential fields for this lens have very similar curves. It’s the only 50mm we’ve seen that is this way, although the Sony and Sigma lenses were to some degree.
Nikkor 50mm f/1.4 AF-S G
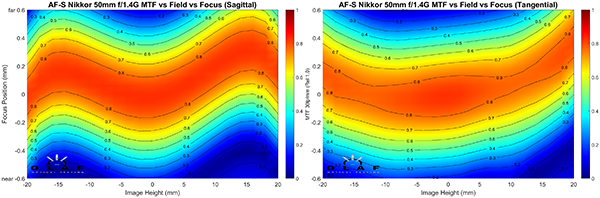
You will probably notice the very slight tilt in the copy of the Nikkor 50mm. Please ignore it, it’s not significant for today’s discussion. This lens has a fairly typical sagittal plane curve, similar to the Canon or Zeiss 50mm lenses, and a tangential field that has a bit of a U curve. You should be recognizing this pattern as fairly typical for 50mm lenses. That isn’t surprising since almost all of 50mm lenses have a double-gauss core design; we’d expect most of them to be somewhat similar.
So Why Do We Care?
Well, for several reasons, I think, only some of which are apparent from this introductory post. I’ll be doing several posts about this over the next week showing you some other things we’re using field curvatures to look at.
Knowing the field vs focus curve of a lens can sometimes help you as you frame a shot, or even choose a focus point. You can certainly see how using an outer focus point for several of these lenses will put the center off focus, or how if you focus-recompose you may get some unexpected change in focus. Having an idea of how the field of focus of your lens is shaped can be quite useful.
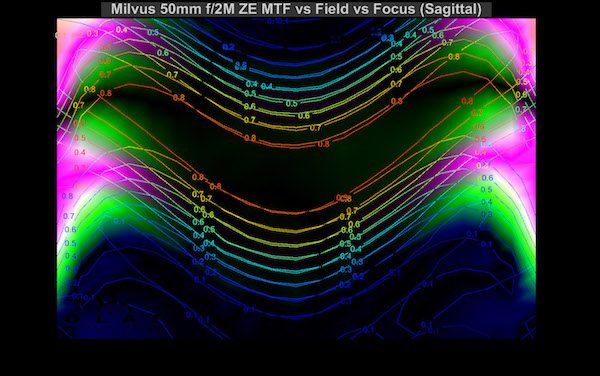
Let’s do that example I promised earlier. Here’s a repeat of the summary graph I made of the two fields for the Milvus 50mm f/2 lens.
In theory, for a shot at distance we would expect the field of best focus to curve towards the photographer a bit as you go from center towards the edge, then get kind of astigmatic and softer at the very edge. Our lab graph, because it’s magnified, is going to curve more than a photograph would, but the pattern should be similar. So I took a Milvus out to a hill behind our office and lined up shots from a position nearly parallel to the slope.
Then I took f/2 shots at a couple of different focused distances on the slope (the tall grass was almost at infinity focus), and ran Photoshop’s find edges filter to find the areas of sharpest focus (grass is nice for this because it becomes just a dark area when you downsize the image).
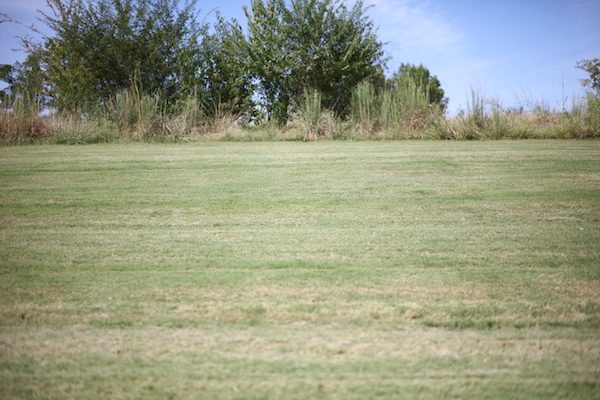
First image:
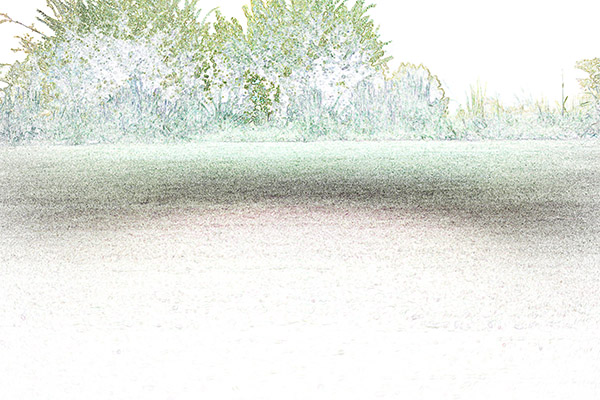
Focused a few feet back
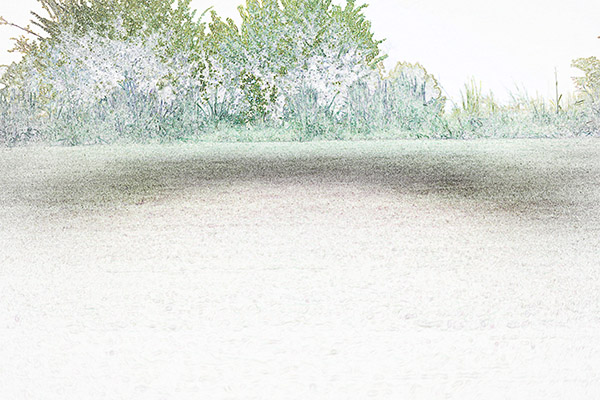
Focused on the tall grass at the top of the hill.
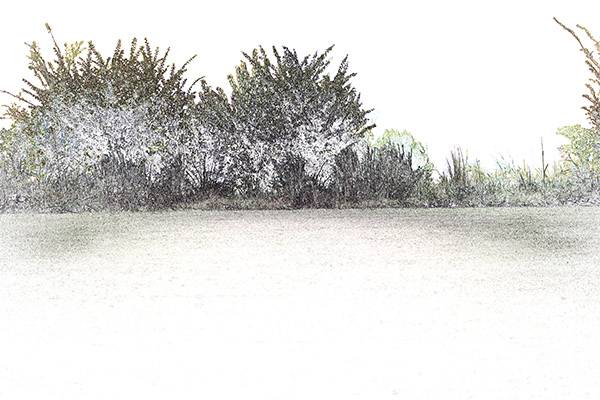
The curvature of the field of focus seems pretty obvious and agrees with what I expected from the lab results. Depending on what you’re going to shoot, knowing this might be useful when choosing a lens. (You can quickly correct for distortion in post processing, but it’s harder to correct for out-of-focus areas.)
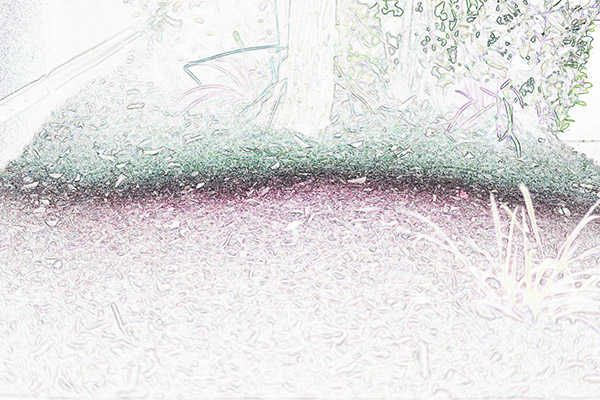
Oh, and remember I mentioned that the 50mm Makro has less field curvature when close, and almost none at macro distances? Here’s the same treatment on a shot of some mulch at about 2 meters distance. There are some other variables here, but I think the field looks flatter, although not as flat as it would at true macro range.
If you’re in the market for a 50mm lens and want to shoot a lot of architecture, than a curved field like the Zeiss 50mm Makro might not be your best choice (yes, I know it wouldn’t be your best option for lots of reasons other than this). It should also be pretty obvious, though, that you can take your lenses out and do just what I did above to get a good idea of what the field of focus curve looks like for any of the. All you really need is a grassy field, or a mulch bed, and Photoshop.
That might not give you as clear a picture of astigmatism as the lab graphs do, though. Astigmatism has quite an effect on bokeh, so knowing where areas of inevitable astigmatism are might help you frame or crop your shots.
Of course, you might not care a bit. Our next post will simply be putting up the field curvatures for a number of prime lenses of different focal lengths, giving you a resource for that. If people find them useful, we’ll start posting more of them. If nobody cares, we’ll just make framed prints of them to decorate the office.
There are other interesting things we are trying to do with field curvature, though, and I’ll get to those in later posts. First among these is adding field curvature to our screening tests. The curves I showed you today are hand picked to be nice and fairly level. In a later post I’ll show you how sample variation causes tilts of the field. It’s an interesting explanation for what many people call decentering. Once you see it, you’ll be able to test for it at home, BTW. But be patient for a bit. Doing this stuff takes time.
Roger Cicala, Aaron Closz, Markus Rothaker, and Brandon Dube
Lensrentals.com
September, 2016

56 Comments
Jeremy Wright ·
Cool information. As I understand this, focus peaking is doing live what you’ve done in the “take home test”. Then you don’t even have to do that work on models with that feature, is that right?
Roger Cicala ·
Jeremy, that is correct. I’ve actually tried doing it with focus peaking and I’ve made some very similar maps. Of course, you need a camera with focus peaking 🙂
sala.nimi ·
+ and – 20mm across means probably 36mm or a full frame sensor?
Mike Aubrey ·
Yep!
Roger Cicala ·
That is correct. 20mm is past the 18mm of the side view, but not quite as far as the absolute corner distance.
Andre Yew ·
Roger and team, thanks for the really interesting tests! Do you know whether the shape of the field curvature stays the same for focusing distances of less than infinity? I know lenses can have very different sharpness behavior at different distances, and am wondering if this applies to field curvature too.
Roger Cicala ·
Andrew, it can change are close distances, although as best I understand, that would be really close, like a meter or so, for most lenses. Well, at least prime lenses. Zooms, are more complex creatures and we’re just starting testing to see how field changes with focal length in those.
Dave Hachey ·
As always, Roger, another useful tutorial. BTW, I love the heat maps.
CarVac ·
It might be beneficial to invert the field curvature graphs so that “up” on the graph means “away” from the camera. It’ll be easier to remember in the field that way.
Otherwise, great work!
Sigurd Ruschkowski ·
Dear Roger:
great article! I have enjoyed many of your and your team´s articles!
I am curious, what sort fo light do you use for MTF measurements? I mean how is the mix of wave lenghths made into (what I presume is white light)? Would a different mix change MTF?
Also, I wonder, if the results above would change if you used 10 or 40 lp/mm?
Best regards,
Sigurd
Roger Cicala ·
Sigurd, we use photopic light – it’s a mixture of red, blue, and green supposed to replicate what human vision sees. https://en.wikipedia.org/wiki/Photopic_vision
The curves might change slightly with a different light with, say, more red emphasis for some lenses, but not a lot. And they wouldn’t change much with change in Lp/mm
Ilya Zakharevich ·
Thanks a lot!
However, you mentioning f/5.6 in the text does not help (as well as you acquiring the finite-distance focus ability recently!). So, to clarify: all the graphs are for fully open lenses at ?, right?
Roger Cicala ·
The field vs focus graphs are at f/5.6 for all lenses. The MTF curves that we do are all wide open.
Ilya Zakharevich ·
In fact, it is quite easy to *recalculate* the provided pictures into how the blur changes in the 3D subjects’ space. Apparently, it matches the “real life photos” provided above!
Note: [0] [Below, we assume that at difference focus distances, the “field of focus” pictures would not change much. This is the best we can do with these data!]
(A) The height of the pictures matches 60µ, while the same distance about the width matches about 30mm. So the scales about the axes differ about ×500.
(B) This means that when “the orange part” looks like (e.g., for Sony FE ZA) a circle of radius 25mm (matching the radius with the ?-scale), the actual radius of curvature is about 500 more (so is about 12.5m).
(C) A photo lens (which must follow the Abbe’s law) has the same curvature of field in the image space as in the subjects’ space.
Note: [1] [In (C), the conclusion DOES NOT depend on the distance to the sphere?—?as far as the assumption in [0] holds.]
Conclusion: if you want to shoot an internal surface of a sphere with radius ?12.5m, with Sony FE ZA, the whole middle 50%×50% of the frame would be in the best focus (w.r.t. tangential resolution). In the outer part of the frame, the best-focus surface goes halfway back.
(D) For some of the pictures, the best fit is not a circle, but an angle (U vs V shapes). For example, for Zeiss Planar, the tangential picture is V-shaped with angle ?120° (with the corner dulled to radius of curvature ?5mm). Rotating about the optical axis, we get a cone with angle 120°.
(E) When recalculating to the subjects’ space, angle changes proportional to magnification.
Conclusion: For Zeiss Makro, in the very center of the subject space, the tip of the best-focus surface has radius ?2.5m (for tangential resolution).
For f=50mm and subject distance 2.5m, magnification=50, so instead of 120°=180°-60°, the best-focus cone has angle 180° – 60°/500×50 = 174°. When focussing further away from the camera, the angle of the cone becomes sharper (while the tip keeps the same radius).
Note: [2] Above, I used this flavor of Abbe’s law: axial magnification is the square of the saggital magnification.
Barbu Mateescu ·
While most of us would simply make some trial&error shoots, this way of calculating might be invaluable for the professionals having limited time on location.
Also, picking Mr. Zakharievich’s brains would certainly improve the already unbelievable wealth of data shown in this blog.
Thanks to the autors, and also thank you to all that are contributing in the comments!
Taki ·
Yet another thought provoking article! Keep up the great work guys, the never ending quest for perfection 🙂
l_d_allan ·
Thanks for the challenging article. I’m looking forward to follow-up’s.
I’m trying to understand the “heat maps” and what they mean.
* In the first two “maps”, the top/first has the label of “Sagittal”. Can I infer that the next/2nd “map” is “Tagential”? However, it doesn’t look all that much like the smaller “maps” side by side for the 35m f/1.4 later in the article. Is that because the former “map” is from an average, and the other is a single copy?
* The label on the right side of the first “heat map” indicates values for MTF 30. but the highest value of the actual MTF 30 “green squiggly line” tops out at about 72 lp/mm. There is a small area near the center greater than 0.9, which seems to be for MTF 10. Is this related to “Relative to 1.0”? Some kind of “normalized”. Or because the “maps” are using f/5.6, and the charts are wide open f/1.4 for the Canon 35mm?
* It would help if the “heat maps” had a label for the aperture used … the article indicated most are f/5.6.
* With a 36mm x 24mm sensor, the diagonal is 43.3, which is consistent with a value in a comment of 22mm at the extreme corner.
* For the 3rd “heat map”, it might help to show a pair of lines of the value at the extreme left and first, such as MTF 10 of 0.86. I’m surprised the extreme corner is that high, but I suppose that is because it is for f/5.6 (and a very good lens).
* Maybe I’m being slow, but I find it ambiguous in the 3rd and 4th images of the grassy horizon to have the labels of “focused a few feet back” and “focused on the tall grass at the top of the hill.” I infer the 4th has the focus further away, and the 3rd with the focus closer to the camera. Correct?
* Are any of the “heat maps” with the aperture at wide open, such as f/1.4 for the Canon 35mm? I think it would be interesting to see at least one, although the article mentioned those “maps” would be harder to read / evaluate.
* Regarding the left-side label that ranges from 0.6 to -0.6, Could this the “translated” to something like how much the focus changed at 1000x focal length (although the measurements are at infinity)? For example, 1000x of 35mm is about 115′, and the “best focus” changed by [fill-in-the-blank].
* Will subsequent articles address “consistency / variance”? My speculation is those “heat maps” could look rather difficult, especially at wide open apertures.
* As far as “presentation of data”, I think the “gold standard” might be the widget that DPR used to provide for lens testing, with “dials” for aperture and focal length. Here’s an example for the Canon 70-200mm f/2.8L IS ii (page 5 from 2010 using a 20 mpx sensor):
https://www.dpreview.com/reviews/canon-70-200-2p8-is-usm-ii-c16/5
Roger Cicala ·
Lynn, good points. I’ll try to address all of them.
The second graph’s label didn’t print, but it is indeed tangential.
I’m not sure I understood this, but the heat map is for MTF at 30 lp/mm. The values (0.9, 0.8) is the MTF at that frequency at f/5.6, MTF being measured from 0 to 1.0 in 0.1mm increments. So the red area shows the area of the field where MTF at 30 lp/mm is at least 0.8. But you are correct, the classic MTF charts are wide open, but we made all of these graphs at f/5.6 so the curves are in common. In further articles I’ll give some demonstrations of how the curve widens as we stop down.
All heat maps are at f/5.6
Remember we’re using actual MTF, not Imatest numbers of MTF50, MTF30, etc. which actually are “What frequency is the MTF 50% (0.5) at. The MTF says “at this frequency, the MTF is 0.x”). They’re opposite measurements of the same thing.
See Ilya’s comments below about the translation. He’s got more math than I do 🙂
This is a lea-in article. One of the major points going forward is going to be showing how field curvature does have copy variation. But I needed to introduce what these are before we get there.
And yeah, DPR has the money for programmers to do that kind of thing. I have interns and volunteers 🙂
Best,
Roger
Brandon Dube ·
> The label on the right side of the first “heat map” indicates values for MTF 30. but the highest value of the actual MTF 30 “green squiggly line” tops out at about 72 lp/mm. There is a small area near the center greater than 0.9, which seems to be for MTF 10. Is this related to “Relative to 1.0”? Some kind of “normalized”. Or because the “maps” are using f/5.6, and the charts are wide open f/1.4 for the Canon 35mm?
MTF at 30lp/mm is entirely unrelated to MTF30! Please do not compare “real MTF” to MTFxx from software like Imatest, the two are not the same functions!
DrJon ·
I’d have preferred it if the top of the graph was further away, like when you were photographing your field (or anybody is photographing the ground, as the sky is usually all inside or outside the DoF). Also the vertical scale says “far” at the top, which further confused me. Could you either flip them or put a small camera icon at the top to show which way you are looking?
speedy fisher ·
I agree. This: “One important thing to note: When our field of focus curve is moving towards the top of the graph, the focus curve of your image is moving towards the camera. Think of the camera as sitting a couple of inches above the graph and focused down toward the center of the graph.” would suggest that “near” should be at the top, but the charts have “far” at the top.
Roger Cicala ·
I totally get what you’re saying. The ‘far’ at the top of the charts should be removed — it refers to the focusing distance of the microscope. From a testing geek standpoint it makes sense, but from a photographer’s standpoint it’s the opposite. This kind of feedback is one of the reasons we do this; so I appreciate the comments. We’ll be changing it, although the next article is largely written and I won’t redo the graphs for that. But going forward we will.
Thanks,
Roger
Stanislaw Zolczynski ·
I wonder where this lens would fit in discussion. Rokkor MD 24mm f/2.8 VFC (Variable Field Curvature) Lens
Roger Cicala ·
I wish I had one to find out!!!!!
etudiant ·
Again a really well written and informative technical article. You are educating us customers to appreciate better lenses. Thank you!
One question, why not just leave both sides of the MFT plots? That seems more informative than averaging them and also easier to understand visually.
Roger Cicala ·
You are totally correct. The main reason is that this is how they’ve been presented forever by camera companies, whether Zeiss’ actual measured graphs or computer generated MTFs used by others. So we were following the herd. The second was our original purpose of setting standards for variation – by using both sides of the lens we get a more accurate picture of variation; or at least that was our plan. Actually, for testing we use both sides at each of 4 different rotations, but unless you’re used to seeing that kind of graph it gets a little overwhelming.
In reality, for testing in house we always use both sides because of the possibility of tilt, and these field of focus graphs do show both sides because (as you’ll see two posts from now) they are a great test for tilt.
Jim A. ·
I hope you appreciate what a great gift you provide for us in articles like this. There is literally nowhere else I can go and read such well thought out and clearly described optical properties as on this blog. Thank you very much for that, and I hope you get to keep it up, I’ve got a lot to learn, and I’m saving RAM in my head just for you guys.
Andrew Garrard ·
I know you hate requests (and I’d rather make nerdy graphing suggestions about using colour channels for different frequencies), but I’m going to beg you to try to put a Nikkor 14-24 through this test, at least at 14mm. I’ve had arguments with Nikon UK about whether mine behaves normally, including explaining to them that I didn’t mean barrel distortion. Mine’s forever locked at f/7.1 to try to hide the effect.
I’d be interested to see one of the recent Petzval remakes go through this, too. Lots of cool graph reading to come! Good luck with it all.
Roger Cicala ·
Andrew, I’m not sure we can get all the way to 14, I think we may have to hold at 16, but when we get to zooms we’ll put it on the list. That being said, there’s a reason we’re starting with primes. Zooms, despite everyone’s deepest desire that they aren’t so, tend to have a lot more tilt issues. Makes sense when you think about how many more groups are sliding up and down.
Andrew Garrard ·
Much appreciated – I’ll take what I can get. And the tilt absolutely doesn’t surprise me. 🙂 I’m hoping for something spectacular from the Petzval, though.
Claudia Muster ·
A great and very enlightening article, as always! Just for the sake of my curiosity: Is it possible to do a MTF chart with refocussing at each mesurement point? I’d be interested to see how such an MTF curve compares to the normal one.
Roger Cicala ·
Claudia, it is although it’s not automated for us. In fact the simplest way to do it would be to pull the data from these field versus focus plots. We may look into automating that pull, but as you’ll see in the next couple of posts, WHERE that sharpest point is can be important too. It may be better to just run the field curve wide open with tighter MTF colors in the heat graph. It’s all still a work in progress. As far as we know, no one has really applied this before.
David Berryrieser ·
This is incredibly interesting work. Since beginning to shoot with a 5Ds, I have begun seeing lens aberrations much more clearly. My Canon 40mm pancake lens shows clear curvature of the focal plane when focused at infinity. This was not detailed in the many reviews of the lens that I had read who tested with imatest at short focusing distances. As a landscape photographer, its a problem.
While recently using the awesome MTF tool you have developed in collaboration with thedigitalpicture, I also noticed low astigmatism that Zeiss lenses exhibit. People refer to a Zeiss ‘look’ that is preferable to the major brands and I have to wonder if it is due to the low astigmatism. Could also be the psychological effect of paying many times the price.
Lee ·
Am I the only one who thinks “camera at the top” is upside down for how my brain wants to interpret these?
Roger Cicala ·
Nope, it seems pretty unanimous. 🙂
Van Forsman ·
nope, http://disq.us/p/1cb2vb8
Lee ·
I wonder how much of a can of worms this opens up with aperture testing. I think we can usually predict in some fairly consistent fashion that MTF lines are going to go up as you stop down, so it’s probably safe to leave those to the imagination, but with this…
Roger Cicala ·
Lee the curve itself won’t change much, but of course the performance will.
Athanasius Kirchner ·
I don’t know if this is at all practical, or possible, but I’d pay to have access to that database. I unfortunately cannot support your business by renting, as I’m located very far away from the US, but all the relevant information that LR posesses would be worth a monthly subscription, at least for me. Yes, there’s bits and pieces in this article or the other, but a condensed online database would be incredible (maybe you could get next year’s interns to do it?) 😀
Anyways, fantastic article, and I’m looking forward to the followups!
Brandon Dube ·
The price one company that performs optical testing would charge to do the MTF vs Field testing we do would be around $3,000 per lens and about $5,000 per lens for the lenses with clear apertures larger than 50mm.
We’ve done that on about 1700 lenses. That’s 5 million bucks of testing.
MTF vs Field vs Focus would be closer to $10,000 per lens. We’ve done that on almost 100 lenses (I think? Honestly not watching the additions to the database too much lately), another million bucks.
What do your reckon the subscription price for access to a database the value of which is north of $5M should be? 🙂
Athanasius Kirchner ·
Well, you’ve got a good point there. I guess the number of users would never justify the expense, and I can’t afford a 1K monthly fee x_x
On the other hand, there’s bound to be a customer base for that kind of info. Maybe if the file costed $100-$200 it would be enough to recoup the cost, at the very least.
Roger Cicala ·
Athanasius, we still don’t know what we want to be when we grow up 🙂 I don’t think there’s any way to make access to the full database a profitable venture, but it is allowing us to offer testing methods that aren’t readily available to manufacturers and some specialty groups. In the meantime we’ll continue to make some of the more interesting things available to everyone free of charge, because this is fun for us.
Athanasius Kirchner ·
I really appreciate all the information you’ve shared with us. Maybe I should think of making a file with what’s available by myself.
Roger Cicala ·
Actually not a bad idea 🙂
Brandon Dube ·
Lowkey when roger retires (the year 3000 may come first) and I buy out the majority share of Olaf I’ll monetize the business by offering testing as a service to consumers, with your lens compared to the database. For cheap. Because IAMA master of automation, AMA.
Athanasius Kirchner ·
Awesome! Now I just need to find the Philosopher’s Stone to last a thousand more years…
Carleton Foxx ·
This is slightly off topic, but if you want to boost company profits by increasing customer demand for those delicious but pricey cinema lenses, you should publish some of their lens test results and explain—in math—how they differ from still camera lenses. Maybe Cooke primes vs. Canon primes? Or Zeiss vs. Nikon?
Just looking out for my buddies in Cordova, TN…
Brandon Dube ·
If you want to demonstrate a high level of correction in cinema lenses, Cooke isn’t the place to start…
Not An ·
I love what you did with this article Roger.
You have first complicated the standard MTF graphs by adding the affect of field curvature and showing that it, just like the standard MTFs differs for sagittal and tangential lines.
Then you have shown a real world application of how this more complex data can be used to discern properties of a lens in real world usage (and the more data we have, the more we know of the compromises that were made during the design and production of an optical instrument and how these will affect performance and also price).
It’s quite interesting to see that there’s always more to optics testing. A phenomenon observed in real life usage can always be explained by science and testing though it’s often difficult to do so.
Viktor ·
Excellent article! If it’s possible to come in with requests, I would love to see these for the Sony Zeiss 24 1.8
Ralph Hightower ·
Some things don’t change. I have the 1980 Canon LensWork book and the FD 50mm f1.2L stops down to f/16, the same as today’s EF 50mm f1.2L.
Nick ·
Have you tested or considered testing lenses with floating elements like the Mamiya or Hasselblad lenses? They have a dedicated ring that is supposed to be set after focusing. My understanding is that they correct field curvature but I’m curious to see how much they matter.
Roger Cicala ·
Nick, we’re not set up to fully test medium format lenses.
Eric Franklin Shook ·
Respect the curve.
Dennis Hancock ·
Thank you for this discussion. Very nice. And a few observations: 1) your MTF data will be a function of the measuring wavelength; please specify that on your plots for clarity; 2) it would be nice to have the f/no put on the plots so there’s no guessing in the future what aperture you’re measuring at; and 3) for extra geek points, it would be very interesting to see and understand MTF vs field plots versus focus position.
Thank you.
Brandon Dube ·
1 and 2 are taken care of in generation 3 of our software which will come out in the future. Though do note now that the measurements are not monochromatic – they are with photopic light. Here is a plot of the spectral weighting: http://i.imgur.com/8OAVBfh.jpg
3 I do not understand – can you clarify? MTF vs Field vs Focus plots are, by their very definition, what you are asking for by my understanding.