You have been patient, my friends. You have made it through the first article, where we looked at how MTFs improve stopped down and saw it was a bit different for every lens. You enjoyed the second article, where we looked at the Best Individual Focus MTF (BIF MTF) which showed how good the MTF could be at different points from center to edge if you focus at that point.
By the end of this third article, you will be able to use terms like “the BIF-BAF point”, “the VLOR”, and the modestly named Roger’s Point to both amaze and intimidate your online forum of choice for months to come. It’s like an early Christmas.
In more concrete terms, we’re going to work with all that data we get with the MTF versus Field versus Focus test to show you something that may also be useful for certain types of imaging; the times when you want as much of the image in focus as possible. That might be a landscape, a group photograph, architectural shooting, or anytime you just want the best overall sharpness possible, and don’t want to shoot stopped-down very far.
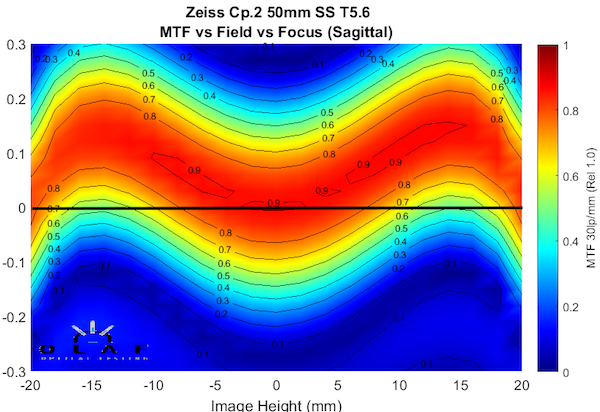
Let’s go back to the MTF v Field v Focus curve I used in the last article, the Zeiss CP.2 50mm Super Speed lens at T5.6.
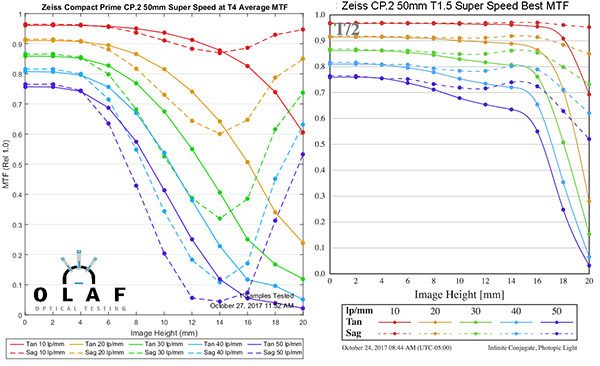
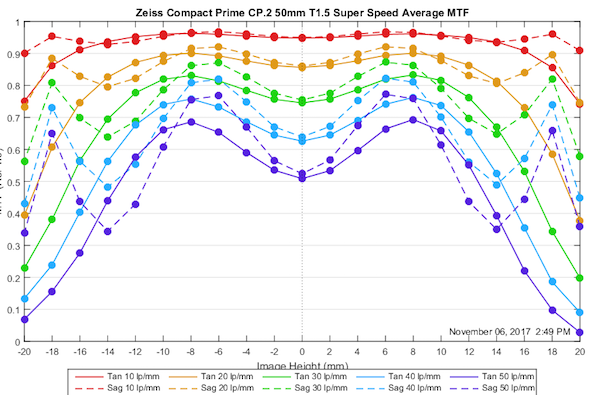
In that article, I pointed out that the normal MTF, which is measured along the black line across the center of the image didn’t show how sharp the lens could be at each position, if we refocused the machine to the sharpest position for each point. That’s the difference between the standard MTF (left, below) and the Best Individual Focus MTF (BIF MTF; below right.)
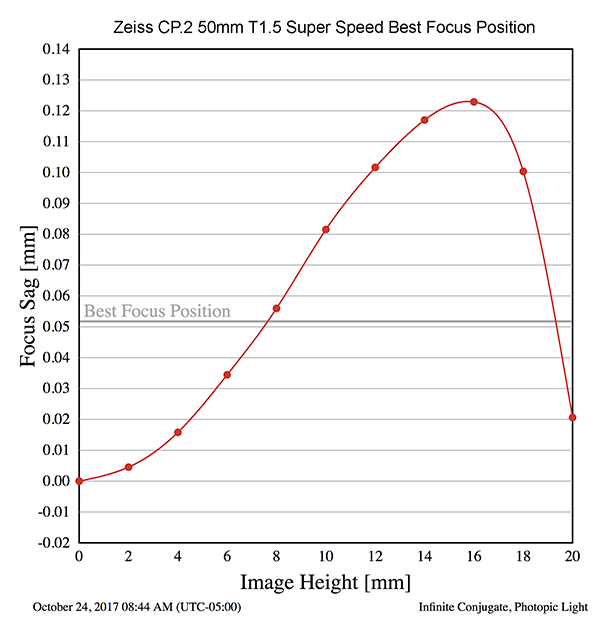
When we take the measurements for the BIF MTF, we also get the exact focus position used to get the sharpest MTF at each point. We can plot that out, too.
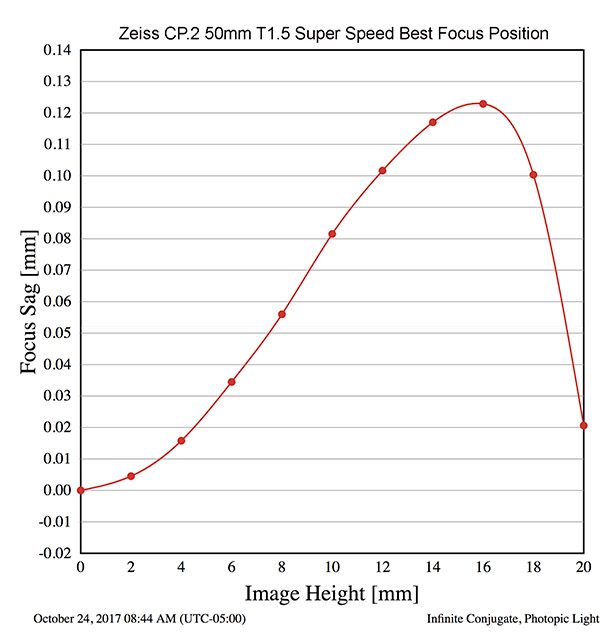
If you scroll back up to the MTF v Field v Focus graph, you can see the best focus position is similar to the curve of one side of the lens (the red area is the area of maximum sharpness). We can run a few more calculations and determine the focusing distance gives the best mean MTF from one side of the field to the other, which we do in the graph below.
To give a more intuitive picture, I’ll draw a second bar across the Field graph from above in green, at +0.052mm.
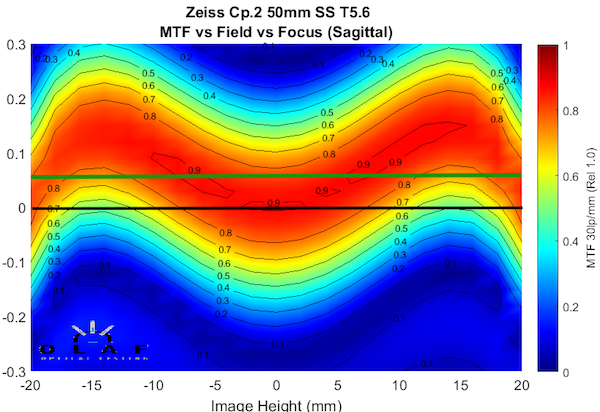
As you can see, the image will be a bit softer in the center, but reasonably sharp from side-to-side. This Best Average Focus distance is different for every lens but is easily measurable.
Of course, if you’re thinking ahead, you’re probably saying, “Well, that’s cool sciencey stuff, but how the hell am I supposed to set my camera to focus the equivalent of 0.05mm in front of center focus?” It’s easy; we go back to that ‘best focus’ chart and find the point where ‘Best Individual Focus Distance’ (red curve) crosses the “Best Average Focus Position” (gray line). This, of course, is the soon-to-be-famous BIF-BAF point.
Here’s where things get real. If we drop a vertical line from the BIF-BAF point (we will call the Vertical Line of Roger {VLOR}) it intersects the image height. (The image height is the distance from the center of the image to the edge of the image.)
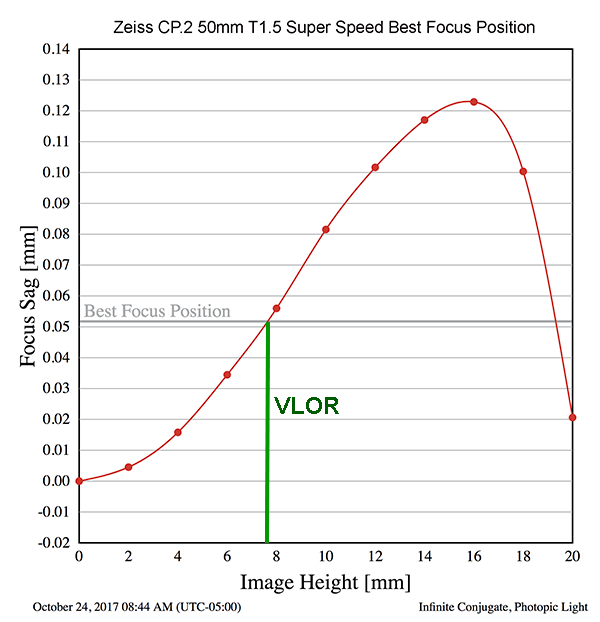
The VLOR points to a position some distance between the center and the side edge of the image (we can call this, oh, I don’t know, Roger’s Point). If you focus your camera at this point, you will be focusing at the Best Average Focus Position, for edge-to-edge sharpness.
A full-frame camera is 17.5mm from center to side. In the case of the lens above, focusing your camera just over 1/3 of the way to either edge (+/- 7.5 mm from the center) will work. You can do it by choosing an AF point in that area or manually in live view. Obviously, you’ll estimate a bit; you might pick 7mm or 8mm but that will be pretty close.
The distance from center for Best Average Focus will vary for each lens. It may also vary a little bit in some lenses depending on aperture (because field curvature can change slightly with aperture) but that difference is probably too small to matter for this technique.
Does This Work?
Yep. Obviously, it isn’t magic. We’re trading a little bit of center sharpness to get a larger part of the side-to-side image reasonably sharp. Let’s see how it works.
We took a Zeiss CP.2 50mm SS off the shelf and ran its standard MTF, side to side. It’s really sharp for +/- 6mm from the center(about the middle 1/3), then it falls off pretty steeply.
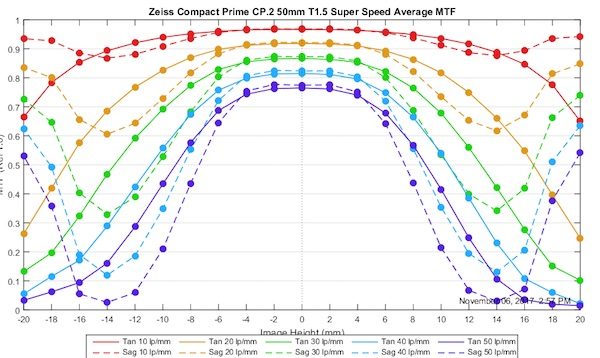
Then we focused 0.05mm further than the best center point focus and ran the MTF again.
You can see now that the best MTF is at about +/- 6 to 8mm from the center, just as predicted. The center isn’t quite as sharp, particularly at the higher frequencies (fine detail) but an MTF of 0.5 at 50 lp/mm is still good. Out at 10 to 14mm away from the center, the image is now usably sharp (high-frequency MTF > 0.3). With center focus, this area had almost lost the high-frequency MTF. With Best Average Focus, the center 2/3 of our image is now reasonably sharp, where with center focus only about 1/3 of the image was.
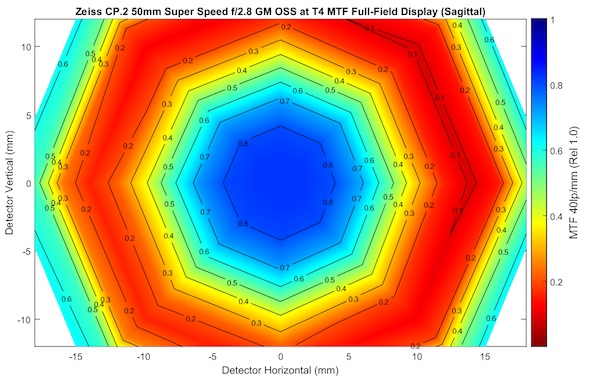
If you want to look at it another way, here are the Full Frame MTF Displays at 40 lp/mm, which is a pretty high resolution. Red we consider unacceptably soft, yellow is borderline.
Center Focus MTF
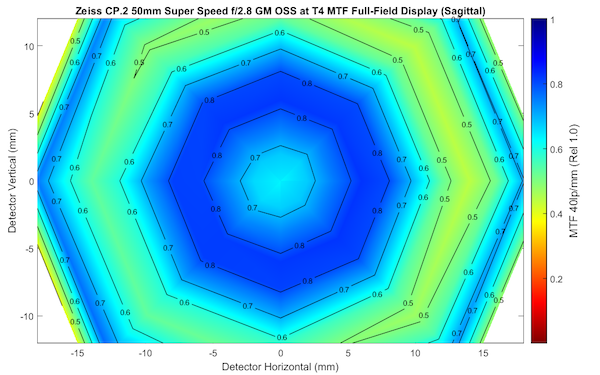
Best Average Focus MTF
The FFD shows it nicely. We’ve sacrificed the center sharpness from excellent to good, but now have the entire image in the acceptable category. This was at T4; things would be a bit better at T5.6.
Again, it’s not a tool you’d want to use for all photography. But when the goal is to get as much side-to-side sharpness as possible, it’s a nice trick to have. It could be useful for landscapes, group photos, architectural shots, and some types of street shooting at any rate.
Another Example
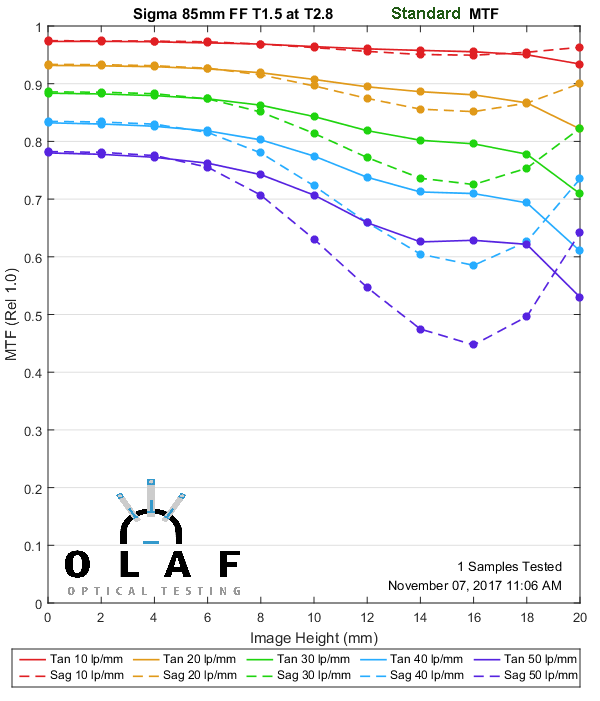
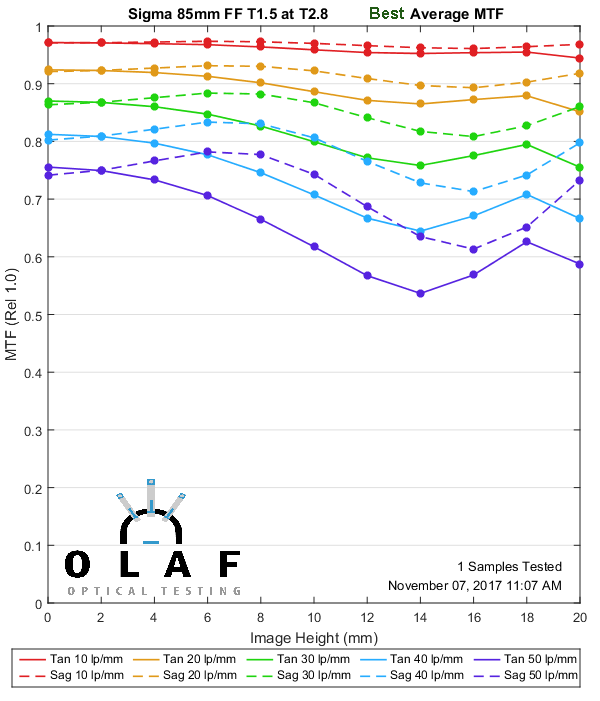
I tried the same test on the Sigma Cine 85mm T1.5. I wasn’t sure that this would make a difference since this lens stays pretty sharp so far from center. I was also interested in this lens because the Roger’s Point was way out at 11mm from center, more than half-way to the edge, which is fairly extreme. Because this lens is so good at T4, I dropped the aperture down to T2.8, so we had a narrower depth of field.
The difference is more subtle, but it’s there. Follow the 0.9, 0.8, and 0.7 MTF lines out, and you’ll lens has a higher MTF at each frequency away from the center. Here is the standard MTF on top, and the Best Average Focus MTF (BAF-MTF) below.
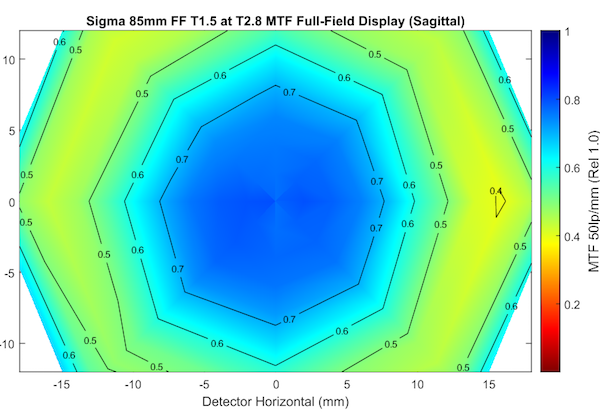
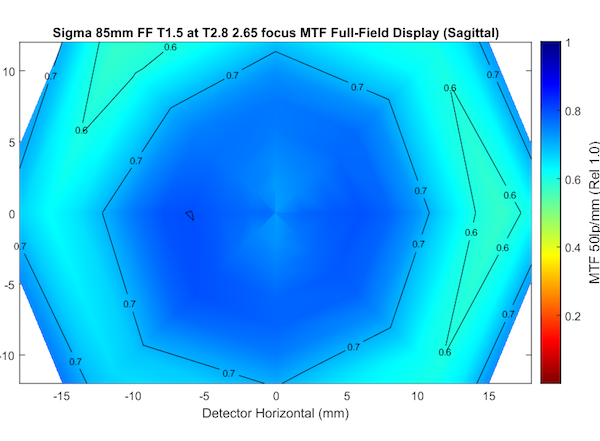
It’s more apparent if I use the Full Frame Display MTF. I’m doing this one at a higher frequency, 50 lp/mm, because the Sigma 85mm T1.5 can handle that, which many lenses can’t. Again, center focus MTF is on top, BAF MTF on the bottom.
BAF MTF Position for the Cine Lenses
I’m not going to (at least right now) show you the MTF curves for every single Cine lens we’ve tested. I’m just going to put up a table of the focus position that will give you the Best Average MTF. One of the questions I have is, do people really want the BAF MTF curves? I think the field curvature graph and BAF Position would be sufficient.
If people really want to see it, we could either just show the BAF Position and the VLOR graph (scroll way back up). And I guess we could show give the BAF MTF curve for each lens. Personally, I think the FFD MTF graphs (the colored circle showing the image field) are best for that purpose.
Until our software upgrades are finished, none of this is automated, though. So, for now, I’m just going to give you the BAF Positions for the Cinema Primes we’ve tested. (They are the same for the photo lens version of each lens.) Since a full frame sensor is 17.5 mm from center to side, it should be fairly easy to estimate where to focus to obtain BAF. You don’t need to count mm, we ran these a bit to either side, and there was no detectable change, so ‘just short of halfway to the edge’ or ‘about 1/4 of the way to the edge’ is accurate enough.
| Lens | Focal Length | BAF (mm from center) |
|---|---|---|
| Canon CN-E | 14mm | 6 |
| Canon CN-E | 24mm | 7 |
| Canon CN-E | 35mm | 5 |
| Canon CN-E | 50mm | 9 |
| Canon CN-E | 85mm | 5 |
| Sigma Cine | 24mm | 8 |
| Sigma Cine | 35mm | 9 |
| Sigma Cine | 50mm | 11 |
| Sigma Cine | 85mm | 12 |
| Xeen | 24mm | 11 |
| Xeen | 35mm | 7 |
| Xeen | 50mm | 9 |
| Xeen | 85mm | 11 |
| Zeiss CP.2 21mm | 21mm | 14 |
| Zeiss CP.2 28mm | 28mm | 6 |
| Zeiss CP.2 T2.1 | 35mm | 0 |
| Zeiss CP.2 T2.1 | 50mm | 8 |
| ZEiss CP.2 SS T1.5 | 50mm | 8 |
| Zeiss CP.2 T2.1 | 85mm | 16 |
| Zeiss CP.2 SS T1.5 | 85mm | 16 |
I’ve made the table sortable so you can look for a pattern, but I don’t see one myself.
So What Does This Mean?
I have no idea. I can see it being a sometimes useful tool. If I did a lot of weddings or group photos, I’d keep the BAF in the back of my mind. It’s kind of counterintuitive to focus on the 3rd lady from center, but it might keep everyone in even focus in the group photo. For landscape photographers it might help when just stopping down isn’t getting everything as sharp as you want. Or perhaps to let you get the shot at f/8 instead of f/16.
Whether that means there’s enough demand for us to publish either the BAF number or the focus curve graph when we do reviews, I don’t know. A lot of times you could probably eyeball it by looking at the MTF v Field v Focus graphs. So I’ll wait for your input on making that decision.
But I think it’s an excellent example of lenses are tools, and the more you know about the tool you’re using, the better you’ll be able to use it. Knowing how far from center the BIF-MTF stays sharp, and where the BAF MTF point is are useful things, no matter how geeky the technique we use to find them is.
Roger Cicala, Aaron Closz, Brandon Dube, Max Bruggeman, and Markus Rothacker
Lensrentals.com
November, 2017

73 Comments
Phil ·
Thanks for this fascinating series of posts! One question… this is measured at infinity focus right? Any idea whether the BAF is likely to be a function of focus distance?
Roger Cicala ·
Phil it is at infinity focus and with modern, non-macro lenses it should be accurate until at least right near minimum focusing distances.
Andre Yew ·
This is awesome, and I’m glad you guys are exploring MTF in ways that haven’t (publicly) been done. I think an MTF-vs-focus-vs-field chart would be very useful already since we could guesstimate the BAF point from it. It would be useful for finding other ways to optimize the focus if absolute MTF wasn’t the goal, like if you wanted to find a point where astigmatism is minimized, or if you cared more about MTF in one direction than the other.
Roger Cicala ·
Andre, we’ll definitely be including MTFvFvF charts in our tests going forward.
Ed Hassell ·
Then, would it be advantageous to incorporate your BAF point in setting AF fine tuning on those camera which offer the function?
Roger Cicala ·
If you knew that’s where you always wanted to focus you could do it. Kind of like a lot of people walk around with their lens set at hyperfocal distance (granted there’s tons of argument about where that is).
Daniel ·
Great, please repeat all tests on all lenses (if necessary) to include the new bifbaf data and as a bonus, integrate the mtf, bif and baf curves, weigh it according to the size of the circle around the center (that’s another integral, right?) and subtract the part, that’s cut off the sensor. Tada: the result is your sharpness score (or scores, if you do it for the different mtfs separately). That would be the most scientific and meaningful sharpness score ever. Cmon, admit it, you like scores 😉
ps: are you going to measure the zeiss milvus 35mm 1.4?
Roger Cicala ·
If I measure the Milvus 35, will you give up on sharpness scores? 🙂
Gomez Garcia Gonzalez ·
I was just thinking how this testing backed up my high opinion of the Zeiss 21mm, with it’s score of 14 being close to the best!
Phil Service ·
Thank you very much for this. I can easily see how to apply the BAF position to images of 2-dimensional subjects. Three-dimensional scenes seem more problematic. Do you move your focusing point to the BAF position, use that to focus on the most important part of the scene, and then recompose? Or, as you say, do you focus on the 3rd lady from center, and not recompose? Do those two methods yield different results? It seems to me it will depend on whether the 3rd lady is in the same plane as the center lady.
For future tests, I would really like to know the BAF position (wide-open and at, say, f/4 or f/5.6 of course :-), unless aperture has no appreciable effect on BAF). It would also be good to have some idea of the cost in lost center sharpness, and the benefit in increased edge/corner sharpness. These can be seen easily enough in the graphics.
Andrew Milne ·
I guess I am back to the same questions that I had on the last post. I love the idea here, but I’m not sure it is quite telling us what we might want (if any number ever could…).
What would happen if you repeated the process for the Zeiss using the tan instead of the sag? Looking at the relationship between the best focus and the field graph, instead of going down on the right the tan graph keeps going up. Which means that when you minimize the area under the graph, the vlor will be pulled to the right.. And if you followed the advice it gives, you would move your focal point further to edge of the frame.
And that might be the right thing to do, practically, but it does seem (1) you are moving it to improve focus in an area (the edge) where the tan MTF isn’t very good anyway and (2) you are moving it to a point where tan and sag are fighting each other, because the field graph for each is moving in opposite directions.
I completely support the overall idea, and I am sure this number is very useful and a vast improvement over what we have. But I have a niggling feeling that there is a parameter that is missing that can’t really be left out. It seems to me that the question “where should I focus to maximize my amount of in-focus” is exactly the right question, and that the answer is “not the center” is really important. But if we want to mathematicize (!) it, then we have to answer the question “how good a focus do I demand?” before we can answer the first question. Because otherwise we could end up focusing in a way which gets us the best (compromise) focus at the edges, but where the level of resolving at those edges is not acceptable anyway, and we have lost the best (compromise) middle. In other words, vlor will be pulled to the left, and further to the left the worse (in terms of curvature) the edges are.
Again, I’m ignorant and don’t know what I am talking about. But I am imagining the following decision tree: I want to resolve to at least X. Well, turns out that my lens will resolve to X only to 12mm across the sensor. Now, where should I focus so as to maximize my X resolution?
Brandon Dube ·
The VLOR is determined from a combination of T and S information, neither one in isolation. We could make it a trust-region like algorithm where it chooses to ignore some field points if they cannot be made to be sharp, but this would substantially raise the computation cost from something that can be done within 5ms via array operations to something that can be done in potentially minute(s) with a smart nonlinear optimizer. Most lenses are not so extremely astigmatic that the difference is substantial, too.
Andrew Milne ·
Thanks!
If you can combine T and S information in a principled way, can you then combine them in a joint MTF v Field v Focus curve? That, to me, would be interesting, because you could read off both resolving power across the image and also the shape of the best-focus region, which would provide the same kind of information about where to focus.
Brandon Dube ·
Just T and S are not enough to produce a good measure of “resolving power” across the frame and determine the shape of the best focus region. You can average the two, but it is not a very good way of doing it. If we had, say, 36 azimuths in MTF-space, it would be enough. 2 is insufficient.
Roger Cicala ·
We can, and that’s what we’ll start showing soon. Also the Tan-Sag difference. So it will look like this: https://uploads.disquscdn.com/images/8f9d207f9623bfa92f31aa3b70c8903c100435062314a1c28de73d1972f82a52.png
Andrew Milne ·
OMG that is so awesome!
Tom Stermitz ·
So MTF and Focus Curvature are two different things, but the ubiquitous MTF lens charts we see are always a mixture of MTF & Focus Curvature? What if you deconvolve the MTF from the focus curvature into a “BAF” measure, and a Focus Curvature measure.
Internet lens measure-bating does seem to put an inordinate amount of importance on high-resolution lenses with flat fields for taking pictures of newspapers taped to the wall.
I guess if we know the the lens has forward curving focus, we could ask the wedding party edges to move in a bit so everybody would be in focus.
In landscape you are screwed every which way (fore-, mid- and back-ground) unless you get a tilt shift lens or focus stack. But it might be useful to know how screwed you are.
Brandon Dube ·
MTF and field curvature are not two different things. “deconvolving” (this is not the correct process) the two does not give you a distinct “BAF” and “focus curvature.” BIF + focal surface sag would separate the two.
In your wedding photo example, if you arrange the people along a curve, the photo will probably look weird, compositionally. We are accustomed to a flat line.
hugh crawford ·
And that is why “barrel distortion” is a good thing. I find a stereographic projection to be much more pleasing for group photos if I have the opportunity.
Nice explanation here
http://michel.thoby.free.fr/Fisheye_history_short/Projections/Various_lens_projection.html
hugh crawford ·
PS
The bridesmaids will thank you. Rectilinear lenses make the people at the edges look fat.
Roger Cicala ·
If you look back at old, wet-plate, large-format camera images you’ll notice the wise photographers of the day did just that. 🙂
Anthony New ·
When I was a child, school pictures were taken with the children in a 180-degree arc and the lens rotated in clockwork with a curved film plane.
Not THAT Ross Cameron ·
Missed opportunity for another of Rogers’ Laws – maybe Roger’s law Of Focusing Lenses – ROFL 🙂
Re aperture testing, I was going to suggest point at which diffraction starts to kick in (f8 on 24mp FF bodies), but is there a point at which DOF from aperture overrides VLOR & Rogers Point? For landscape, it could still be used to help with determining where in frame to focus in conjunction with hyperfocal distance…
Tis all good for thought. Luv ya work!
Roger Cicala ·
It would differ for different lenses. The more interesting (to me) part is that depth of field is narrower as frequency increases. So it’s easy to get depth of field at 10 or 20 lp/mm that covers the whole field. But at 50 (fine detail) it’s not happening ever.
So you can get a nice contrasty look over the whole image, but you can’t simply use depth of field to pick up fine detail on a high-resolution sensor.
Not THAT Ross Cameron ·
Thanks for the insights – reminds me my lack of knowledge is vast – will have to live with it as I don’t have the time or budget to remediate it. This series is a goldmine.
BTW – a ‘law’ doesn’t have to be framed positively, it can be in the negative 🙂 I.e. Thou shalt not find thy lens’ BAF in its centrum. Seek towards thy lens’ periphery for the famed Point Of Roger, after enduring the tribulations of VLOR 😉
taildraggin ·
My name is Roger. Roger of LenRentals. I arrange, design, rent and sell lenses.
Zak McKracken ·
Actually … assuming this can be automated, and OLAF has enough time to go through it:
Run an MTF vs focus test –> adjust aperture one bit –> repeat
Once you’ve gone through all the aperture settings, you can work out at which setting the maximum sharpness can be achieved, at which point in the image. You could then make a map of that: “best” aperture over distance from image center. Of course not all frequencies behave the same way, but if you use one from the middle of the range, they should correlate reasonably well. So, although sharpness isn’t just one number, most measures of sharpness will be optimal at the optimal aperture.
Or! You could slice that map of MTF as function of focus, location and aperture, and generate curves for sample distances from center, showing (say) saggital and tangential MTF as function of aperture, at ideal focussing distance. A user could then pick an aperture from that graph to balance out sharpness on the parts of a particular photo that matters to them.
Or! Define depth-of-field for different frequencies, then use that instead of MTF in the previous plots…
…really, there’s a lot of useful things one could do with such data. I’m sure there would need to be some experimentation, though.
I’m definitely unsure if you guys would have the time to actually generate that data for a significant number of lenses… Especially as I’m suspecting these plots could be doubly useful for cheaper lenses, to find strategies to work around their limitations, and there a lot more cheaper lenses then the nice expensive primes you’ve measured for this article.
Devil's Advocate ·
Perhaps the best thing is to give us the raw data so we can do it ourselves and reduce Roger’s workload? Effectively crowdsourcing the site for a better ‘product’.
Zak McKracken ·
Actually … I think I’d quite like to play with that kind of dataset.
The graphs all look like Matplotlib to me, so the data probably exists in some format which is easily-digestible from Python, which is my favourite toy anyway 🙂
I don’t really have a lot of time, as evidenced by the lateness of this reply, but I think I’d have fun slicing and dicing the data a bit… if this is something that Roger and Co are okay to give away to randos…
Ionut Macri ·
Looks like 40 years ago Minolta had a odd lens based on that http://www.rokkorfiles.com/24mm%20VFC.htm
maximum ·
Wow, now thats an interesting lens!
Roger Cicala ·
Someone actually loaned me one of those a while back to test. It was fascinating you could definitely change the shape of the field very easily. I don’t think I kept the files, I sent them to the person who asked me to test it.
User Colin ·
This is interesting however I am wondering how it interacts with the accuracy of focus points. I assume contrast-detect focusing will be accurate, if slow, across the frame. But there must be a reason why the centre point is usually given all the bells and whistles wrt phase-detect focus ability. And in some DSLRs, the grid of PD focus points only fills the centre third. So would it be wise to use one of those outward focus points if it wasn’t actually as accurate?
Are you planning to look at focus shift? From what I understand, it is more of a problem with closer focusing, and you always seem to test at infinity.
Roger Cicala ·
We are testing focus shift going forward. It occurs everywhere, although some lenses it might be more significant at closer focusing.
Ilya Zakharevich ·
“…determine at what focusing distance the largest area of the image is within that sharp area.”
Am I alone in being disappointed by vagueness of the part «that sharp area»? (But: a lot of thanks for the rest of the post!)
Roger Cicala ·
Poorly worded indeed. I’ll try to get that more specific sometime today.
Ilya Zakharevich ·
I think the description did change?—?but now there is no explanation whatsoever in which sense the focus shift of 52µ is “the best shift”. Without such an explanation, one would get strange suggestions (like one above, where ½ of the best shift is considered as “yet better shift”)…
Brandon Dube ·
We will write and publish a paper that explains the algorithm within the next year or less and publish it in an open access journal. It is related to my thesis topic and not currently public.
Roger Cicala ·
Actually I hadn’t changed it until this morning. Yesterday was one of those days.
boeck hannes ·
unfortunately my nikkor Ai 85mmf2 is missing in your list!
very valuable information since i actually shoot flat things a lot! thank you so very much!
Adrian Bujor ·
Impressive and useful info, thank you a very big lot for this series.
By reading this now i’m thinking that for general photography one might be much better to focus at 1/2 BAF distance from center. Center still very sharp, extends the sharp area less than full BAF, but still a good amount. I’m thinking this can be done (with phase detect) by micro-focus adjustment.
Do you know if there is any correlation between the adjustment values provided by the manufacturers in camera for adjusting (those +/-N things) and actual focus values (from the MFT vs Field vs Focus graphs)?
Roger Cicala ·
Adrian, in-camera adjustment, as in micro focus adjustment, etc. has nothing to do with this. It’s basically fine-tuning the cameras AF system to the lens. So a separate maneuver.
I think what you suggest is very practical. The concept is one I’ve never considered before, and I can see lots of ways to use it: like you suggest, as an aid for ‘hyperfocal distance and leave it’ shooting, etc.
Adrian Bujor ·
yes, i know it is a different feature… but i was thinking like this:
Setting the AF (via micro focus adjustment) to focus a bit further … does that means that i can tune it to back-focus constantly with a 0.05 focus correction (considering i do correct microadjustment + the required delta)?
That would basically allow one to use the center AF point while shifting the focus point with the BFP modifier (so obtaining the same effect as focusing at BAF distance). After all micro-focus adjustment does exactly that, focus and adds a focus delta, right?
Roger Cicala ·
Ah! Now I understand. I think that you could do that, with a little trial and error.
Lo-Wok Li Ya ·
Roger, this is something completely new and extremely useful! THANKS!!!
You’ve introduced new and meaningful graph for lens testing and use! CONGRATS!
Whist the previous post was not so clear for me (I mean the practical aspect of that info), this article now gives the easy usage scenario.
Zak McKracken ·
To me at least, the use of the graphs in this post is mostly for getting the most out of “flat-wall” pictures*, whereas the graphs in the previous were much more useful for understanding when not to focus and recompose (and rather use the off-center focus points), and comparing lenses in terms of achievable sharpness (which in many cases is the more realistic scenario than results from center-focussed tests)
* not trying to diminish those, as I do shoot murals quite a bit, as well as more scientific applications — but in general, most scenes are 3D, and in that case planarity does not matter.
SpecialMan ·
Awesome info that makes complete sense; I will immediately start focusing on the third lady from the center in group shots.
One small request: Could you at least pretend like you thought about including Nikkors in your blog posts.
Brandon Dube ·
If Nikon made cine lenses, they might be included in a test of a batch of cine lenses 🙂
SpecialMan ·
Manual focus Nikkors have been a mainstay in independent cinema for quite some time.
There’s an interesting test of the lenses here.
https://thecinelens.com/2016/10/04/the-ultimate-vintage-lens-test/
Brandon Dube ·
Nikon does manufacture cinema lenses. You will notice that each lens here is a cinema lens.
SpecialMan ·
Yes. It’s true. Sadly.
Roger Cicala ·
OK, I have been ignoring Nikkors a little bit lately. I’m going to do this, over the next couple of months for all the major primes, and I’ll make sure the Nikkors are first or second. Actually, I’m interested to see because Nikkors emphasize a flat field to start with. It may be of less benefit with them, but we’ll definitely check post them.
David Bateman ·
Wow very interesting data.
I think you will now become famous as this might catch on as the next ETTR technique.
The only problem is now you will get 1 million lens test requests.
Looking at the data a possible general rule depending on camera and focus point density, would be to always use the 3rd or 4th focus point to the right.
Professional Photographer ·
Genius, genius, genius!!! Lifesaving information that I need in my daily work!!! Thank you, thank you, thank you!!!!!
Samuel H ·
Definitely useful*. But I’m not good at mentally dividing numbers by 17.5. I’d rather get the information in % (i.e. 6mm becomes 30% which means I have to focus 30% away from the center, right on the rule-of-thirds marker).
* The stuff you usually publish is useful when looking at which lens to buy, this doesn’t help much that way, but once you’ve chosen a lens this will help you get the most out of it.
Vít Koval?ík ·
Highly interesting, thanks for your article! And all others as well, this is a cool blog at its entirety.
Now I am wondering about using focus-and-recompose (F-R) technique to focus according to the rule of thirds. Since the F-R may “by definition” result in focusing at different distance than the object is placed (a well known issue), I guess the field curvature may cancel out this issue on some lenses and worsen it on others.
So while two different lenses are perfectly fine, if a photographer is frequently using the F-R, one lens suit their personal needs much better then the other precisely because of this combination.
Vít Kovalčík ·
Highly interesting, thanks for your article! And all others as well, this is a cool blog at its entirety.
Now I am wondering about using focus-and-recompose (F-R) technique to focus according to the rule of thirds. Since the F-R may "by definition" result in focusing at different distance than the object is placed (a well known issue), I guess the field curvature may cancel out this issue on some lenses and worsen it on others.
So while two different lenses are perfectly fine, if a photographer is frequently using the F-R, one lens suit their personal needs much better then the other precisely because of this combination.
bdbender4 ·
Holy Cow, Batman! BIFF!! BAFF!! On the comic book pages of decades past Robin made camp comments while Batman socked the bad guys on the chin to the accompaniment of sound effects.
Now, these humorous addenda have found their true place in history, as useful new tools for the consideration of lenses.
All kidding aside, I’m not kidding.
Scott Kirkpatrick ·
I wasn’t sure from the article how you do an average to come up with the off-axis focus point at which you find the Best Avg Focus. It sounded like you were weighting the average linearly along a radius from center to edge. But if you want maximum sharpness at all areas in the image, shouldn’t the weighting be by area (that is by the square of the distance from the center of the field)? This would push “Roger’s point” further out in the smiles and moustaches that you show as typical field curvature results.
Luzius Schneider ·
Thank you so much for this interesting and useful post!
I would be happy to get the BAF for as many lenses as possible.
May I propose, that you add a number for front- back- focus relatively to the reference “center focus point”. This way, I could guess easily, how much it matters to use BAF or center point for a certain lens.
I really appreciate your work and read all your posts!
Mike Earussi ·
I find this information very useful in that it shatters the myth that the best overall focus at infinity is created by focusing as sharply as possible in the center.
I have several lenses that I deemed unfit for landscape photography because I could never get the edges sharp enough that I will now retest using your newly discovered principle. Thanks
Stefan Steib ·
Hi Roger
I have recommended this kind of focusing to our Lenscustomers for years now. Especially for Shift Lenses this is an essential improvement. Especially as you may not even see the center of the original image circle at all. I would even expand this and say adding a tiny bit of tilt to a shifted lens may defeat field curvature even better when there is significant amount of shift.
I have shared this great article on our Facebook Hcam.de pages
Thanks for all your great work !
Stefan
Roger Cicala ·
Thank you, Stefan!
Zak McKracken ·
I second the usefulness of applying this to tilt/shift lenses (or regular lenses on Scheimpflug adapters). I know some people working on PIV* methods who’d be really happy to know exactly how to get the most planar focus plane with a tilted lens (and which lens to use).
* https://en.wikipedia.org/wiki/Particle_image_velocimetry
hywelphillips ·
Fascinating!
So as a rule of thumb given that I like off-centre compositions most of the time, focussing at one third the way out where my subject is likely to actually dwell, especially for video will as if by magic, get pretty close to the BAF point for a lot of lenses. It might be worth doing focus-and-recompose with an offset focus point instead of a central one, too, depending on the lens. 🙂
Is there a good rule-of-thumb to eyeball it based on the MTF vs FvF graph?
Frank Kolwicz ·
How does BAF compare to hyperfocal technique (HT)? I’ve used HT for distant landscapes with all kinds of film cameras and with a Zeiss 100mm Makro on a Canon 5DsR (an astonishingly good combination). Did I just happen to hit on a lucky combination of great hardware and sufficiently accurate HT lens markings that coincide with BAF?
Zak McKracken ·
” If I did a lot of weddings or group photos, I’d keep the BAF in the back of my mind” — not sure, really, because your wedding guests will probably not line up on a plane.
These numbers are certainly super-useful for reproductive photography (photos of paintings, books where you can’t use a scanner) and many scientific applications that need a sharp imige of a planar surface, but I’m kinda thinking it might be easier to get the wedding party to align with your lens’ focus surface than the other way round.
The MTF v Focus data, though, could be quite useful for a wedding photographer to pick a lens where the focus surface aligns with how they like to line up the guests in the group pictures…
One thing I’d like to change about them, though, is the y axis, because I think that’s currently the distance from the nominal image plane (because you move the lens, no?) — not something a photographer can directly set. But if I’m not mistaken, that should map directly to distance from the camera and could therefore be shown as a percentage of object distance (or would that be the inverse of object distance?)
So the plots should allow me to make this type of conclusion (arbitrary example numbers): If I focus on an object in the image center, then at 1/2 image width, the best focus is 10% further away from the camera than the object i focussed on. That should make it easier to work out where in space the focal surface ends up.
Brandon Dube ·
You can’t use a %, because the relationship between image position and object position is nonlinear (but there is an equation).
Something we could do is pick a nominal object distance (or ensemble of them…) and translate the y axis to object distances. So the “0” would be “5m” and you might have an axis that goes “6m..5m..4m,” but it could also be “inf..1mi..30ft,” for example.
I suppose we could do the near and far as a %, but that is not so intuitive a unit, to me.
Another issue is that in wide angle lenses in particular, the astigmatism changes dramatically as you focus closer, so these surfaces would not be the same at, say, 1.5m focusing distance.
Zak McKracken ·
Oh … makes complete sense. Of course, if you focus to infinity, them locations closer to the lens would be mapped “past infinity”.
Does this mean that the focus field data you’re measuring is also
dependent on the focus distance of the lens, or would changing focus
only cause a simple shift on the y axis?
Soo, if focus affects astigmatism, then theoretically you’d have to add another degree of freedom to the dataset, wouldn’t you?
Yay! Let’s add the ability to test at variable focus distance to the bench! And figure out some way to present _that_ data in a sensible way!
Brandon Dube ·
> Does this mean that the focus field data you’re measuring is also
dependent on the focus distance of the lens
Yes. Until you get within, say, 50-100 focal lengths it probably changes very little. But at closer distances it will change, dramatically so in wide-angle lenses.
We can test at variable focusing distances, but only at distances 0 – 1.4m and infinity. A lot of important ground is inaccessible.
Presenting it would just be putting a slider for focus distance.
Andrew Garrard ·
Coming to this very belatedly, I’m afraid, but this seems very useful – thanks for all the hard work, Roger.
Sorry if this is a dumb question, because it’s too long since I read the background to your test process, but my concern is the extent to which field curvature varies with focus distance. I’m reasonably sure that at least some of my lenses have variation (where they have CRC elements, at least). I’m forever fighting the field curvature on my 14-24 Nikkor, usually by hoping f/7.1 will hide it. It’d be nice to do better that “hyperfocal and hope for the best”, especially at large apertures.
I suspect asking for a graph of BAF-point vs focus distance will just result in it not happening, but it’d be nice to know whether I’m worrying about nothing.
Anthony New ·
I would add that in my experience (mostly with cheaper lenses) field curvature can vary a lot with focus distance. I have little faith in simplistic chart measurements. A flat brick building at 50m can be a useful DIY test of corner behaviour, but more information can often gained by photographing bare tree branches at 50-100m, where both field curvature and axial & lateral CA can be distinguished in branches at different distances in the same part of the visual field – one image doing the work of many, and can indicate issues that chart testing usually doesn’t. Of course, we don’t all have Roger’s equipment available!
Marek Miszczak ·
Very nicely done – it’s a thing I started doing years back, when I first started switching to manual lenses.
I first noticed how different in terms of sharpness (edge) sometimes my photos were, while center sharpness stayed generally the same. Then I read about this mystical field curvature and did a lot of testing of my lenses and learned how to focus them properly, including curvature influences.
Now the things that I think need to be mentioned:
Any kind of indicative lens charts are probably going to fail you – there are too many factors at this level of detail that come into play (like lens variation or even sensor-to-mount aligment) and you’ll have to check for best results yourselves anyway.
MF lenses superiority vs AF – AF lenses will give you random results at focusing, especially at infinity and especially at off center points. MF in high magnification via LV is mandatory and that might be a problem with AF lenses (short and clunky ring throw) – it might just hold you back from doing that final minimal focus tweak (remember focus throw – around infinity it gets crazy)