Geek Articles
Developing a Rapid MTF Test for Photo and Video Lenses
. . . Or What I Did for the Last Year Instead of Having a Life.
Nearly a decade ago, I started testing lenses. A few years later, after I complained about a manufacturer’s claiming an awful lens was in spec, an engineer patted me on the head and told me “you really don’t have the background to understand metrology.” Those of you who know me realize I didn’t take this well.
Following the principles of ‘Anything Worth Doing is Worth Doing to Excess’ I changed my name to Inigo Montoya and went on a quest. It’s taken countless hours and dollars, but I get immense satisfaction knowing that for the last two years that same manufacturer has been paying me to test their lenses. Not that I hold a grudge or anything.
For the last year, it’s gone to a new level. Some of you have probably noticed a lack of blog posts from me lately, so I thought I’d tell you why.
WARNING! THIS IS A GEEK LEVEL III ARTICLE. It’s about testing, not image making. If you aren’t a lens geek, there’s no reason to read further, but worth reading if you want to learn something.
Developing a Rapid MTF Test for Photo and Video Lenses
A Brief History of My Life
Over the last decade, we have steadily increased the level and complexity of our optical testing. We started with computer analysis of chart images but found the process was slow and too variable for our purposes (results for the same lens could vary by 5% with slight changes in alignment or lighting).
An MTF (Modulation Transfer Function) bench gave us much more accurate and reproducible results. Pretty soon, though, we found that a standard MTF (measuring from the center to one side) missed a lot; lenses are not really rotationally symmetric (the left side may not be the same as the right side, etc.). Some lenses look fine in one area but are not fine in others. In other words, testing 1/4 of the lens was not a good test.
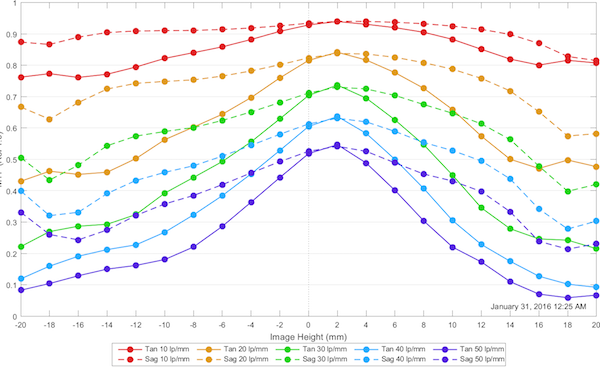
Olaf Optical Testing, 2016
So, we developed a 4-rotation MTF tests; testing lenses from one side to the other at four different angles. This lets us look at all four quadrants of the lens, and we stopped missing lenses that were soft on one side or in one corner. We tried 8 and 12 rotations, too. They took a lot longer and didn’t detect anything that four rotations missed.
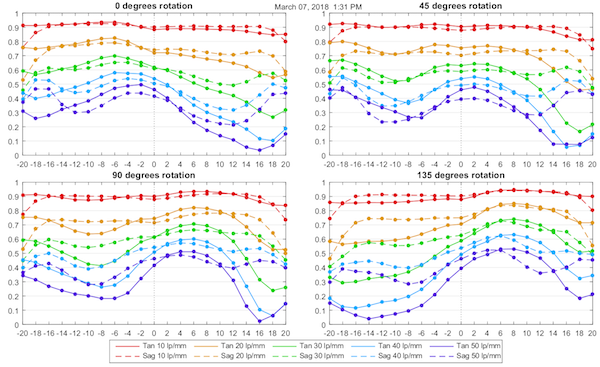
Olaf Optical Testing, 2016
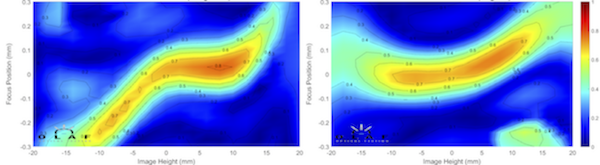
Now we had very accurate testing, but looking at four rotation MTF graphs like the set above can’t really be described as intuitive. So some of our guys developed Full Field Display plots that showed us the information accurately, but much more intuitively.
Olaf Optical Testing, 2017
Now we had testing that did a great job of showing us when a lens wasn’t quite right, but it didn’t always show us WHY a lens wasn’t quite right. For example, we couldn’t tell if one side of the lens was soft because of optical decentering, or because of field tilt.
More importantly, we’ve found that about 2% of lenses that looked fine on chart or projector testing are not really fine. Why does that matter? Because when a customer takes critical images of 3-D scenes, especially on today’s high-resolution cameras, the customer will see defects that 2-D testing missed. And that customer is pissed.
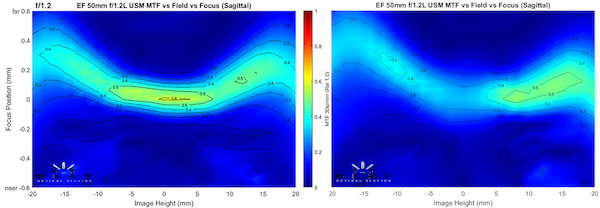
That led us to start doing MTF vs. Field vs. Focus testing (AKA Field Curvature). Doing field curvatures showed us a lot more because it looked at how the lens resolved in 3 dimensions rather than the two dimensions of a test chart or lens projector.
Test charts and projectors could tell us a lens was soft on one side or the other. Testing the field curvature let us determine if the softness was because the field was tilted.
Olaf Optical Testing, 2016
Or because the lens was decentered.
Olaf Optical Testing, 2016
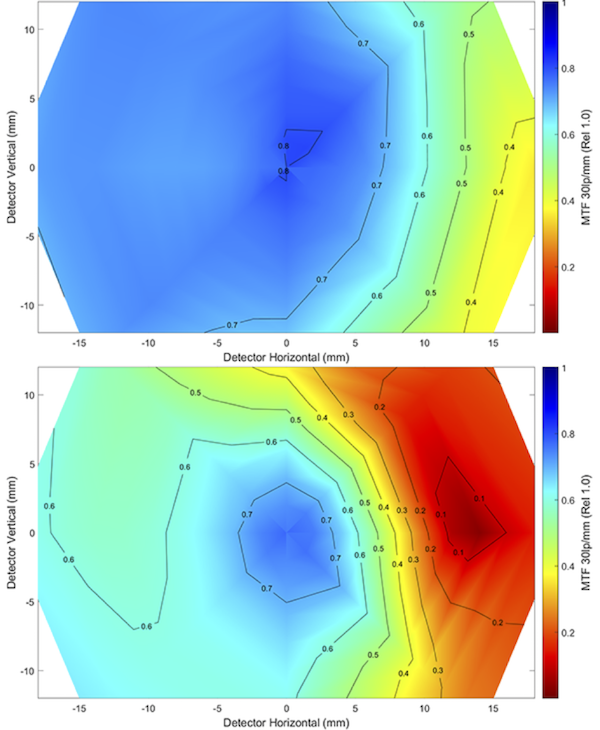
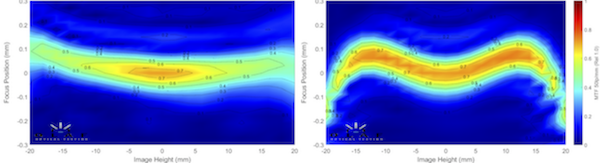
It also let us determine if a lens normally had field curvature. In the example below, the left side shows little field curvature, but the lens gets soft away from the center. In the right example, the lens stays sharp away from the center, but the field curvature makes it sharp at a different focusing distance than ‘best focus at center.’ On a standard MTF test, which is done at best center focus, they look equally soft away from the center. If you take images of a 3-dimensional scene with them, they look entirely different.
Olaf Optical Testing, 2015
Somewhat to our surprise, we also found that some ‘bad’ copies of a lens had different field curvature than was normal for that lens. Not tilted or decentered, but an entirely different shape than most lenses of that type. So checking for normal field curvature is yet another test that gives us useful information.
Field curvatures were a major addition to our testing, but man are they slow. It takes 15 minutes or so to do a 4-rotation MTF graph. It can take 30 minutes to do just one slice of field curvature. Four rotations of field curvature requires more time and patience than we have.
So, Here We Were
After years of refining our testing techniques, we could accurately determine how well a lens resolved across the entire field of view. We could determine if the field was curved or tilted. And we could tell if the lens suffered from some form of optical maladjustment.
It was far more accurate than any type of chart or projector testing. It was, as best we could determine, the most detailed testing of lenses available anywhere. It was written up in peer-review journals and presented at optical society meetings. (1, 2) Several manufacturers and end-users like Caltech/NASA Jet Propulsion Laboratory used us to test their lenses in this way.
But, thoroughly testing a single lens like this takes an hour or more. Even doing just the 4-rotation MTF test took at least 15 minutes. That’s an eternity when you need to test hundreds of lenses a day. Many hundreds of lenses.
So, we tested lenses on the bench periodically but relied on test charts and lens test projectors for everyday testing. There was just no way to test hundreds of lenses on the optical bench every day.
But as camera resolution increased, standard testing had trouble keeping up. We knew this was coming and have been working for several years to figure out some way to get high-resolution testing that could be done rapidly. We didn’t quite make it in time, but we made it nearly in time (see addendum).
So What Did We Do?
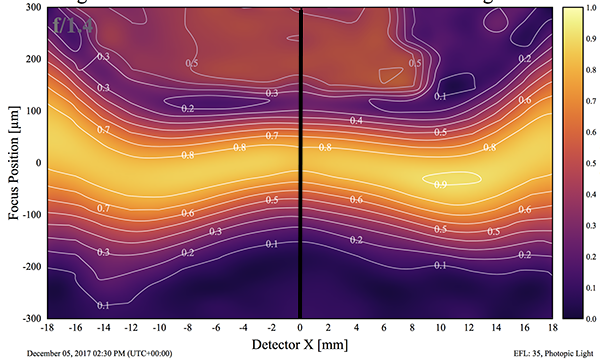
We start with the simple test that is the basis for MTF vs. Field vs. Focus; a test called the Through-focus MTF. Let’s look at another MTFvFvF graph. The horizontal axis is the lens field from one side to the other, and I’ve drawn a black line at the center of the lens’ field. The vertical axis is focusing position and “0”, in the middle of the vertical axis, is the proper focusing distance for the lens we’re testing.
Olaf Optical Testing, 2018
Through focus MTF starts out of focus, measures the MTF, moves forward a few microns, tests it again and repeats this starting at ‘back focused’ and going to ‘front focused,’ making MTF measurements along that black line in the center position. The ‘through focus MTF’ at the center would look like this:
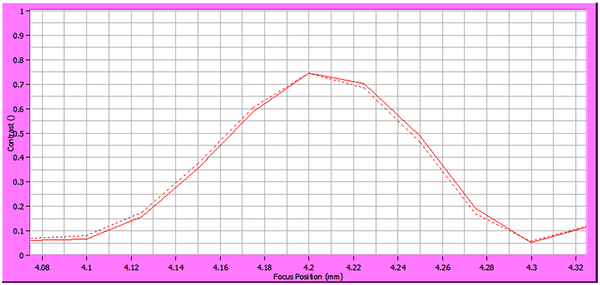
Olaf Optical Testing, 2018
You can see the highest MTF is right where it should be, at 4.2mm (that’s the bench’s position for Canon mount lenses). The MTF there is 0.75 for both sagittal (solid line) and tangential (dotted line) rays. Away from that point, the MTF gets lower and lower because the lens is more and more out of focus.
So, Through Focus MTF tells us what the highest MTF at that point is, and at exactly what focusing distance it occurs.
If we repeat this away from the center, the graph looks different and actually gives us more information. The graph below is from the same lens at 14mm away from the center (about ¾ of the way to the edge of the image). You should notice the highest MTF is now about 0.55; like most lenses, the MTF is lower this far from the center.
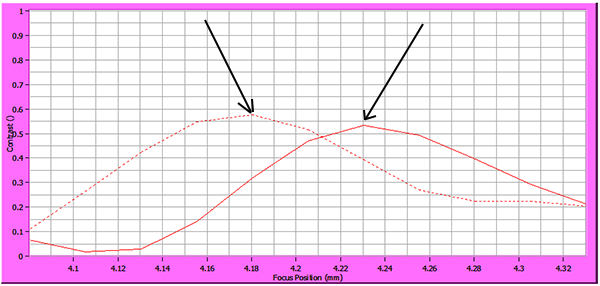
You might also have noticed that the highest MTF (black arrows) is not at 4.2mm now. The sagittal best focus is at 4.23, the tangential at 4.18. This is astigmatism; the sagittal and tangential lines don’t focus at the same point. If there was field curvature, both peaks would be on one side or the other of the best center focus (4.2mm).
How do we decide if that’s OK or not? We’ve tested a couple of dozen copies of this lens and determined the range of what’s acceptable. For every lens, we know how high the MTF should be at the center and near the edge, how much astigmatism the lens is supposed to have, and how much field curvature (if any) there should be.
The above graph showed the lens at just one side of center. To get a more complete picture, we rotate the lens on the bench, testing it in each quadrant. Now we have done Through Focus MTF at 5 locations, the center and near each corner.
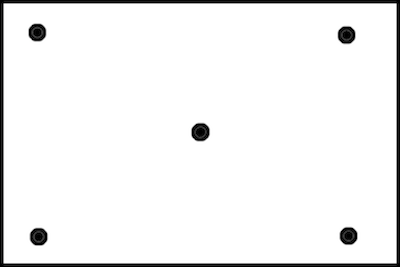
If we plot all of this on one graph, it looks a bit more complicated at first glance.
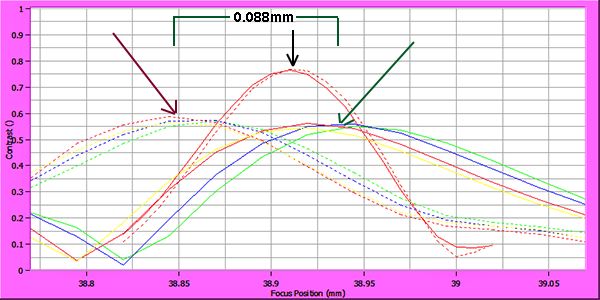
Olaf Optical Testing, 2018
So, what all do we see here? First, I’ve pointed to the center MTF peak with the short black arrow. To the left of that, the red arrow points to the tangential MTF peaks (there are 4 of them, but the yellow one doesn’t show up very well). To the right, the green arrow points to the sagittal peaks. I’ve measured the focusing distance between the sagittal and tangential peaks, which gives us a numeric value for astigmatism. I didn’t show it on this graph, but we calculate out the difference of each off-axis peak from center focus and from each other as well.
Each type of lens is somewhat different, but as mentioned above, we know what to expect for each one. For each lens, we program a set of pass-fail criteria that looks something like this:
Lens X
- Center MTF > 0.68 (Sharpness)
- Off-axis sagittal MTF > 0.55 at all 4 locations (Sharpness)
- Off-axis tangential MTF > 0.5 at all 4 locations (Sharpness)
- Sagittal-Tangential peak difference < 0.2 (Astigmatism)
- Largest Sagittal-Sagittal peak difference < 0.5 (Tilt)
- Largest Tangential-Tangential peak difference < 0.5 (Tilt)
In the center and each corner, we’ve tested the lens for adequate sharpness, amount of astigmatism, and amount of tilt. The above lens not only passes, but it’s also a very good copy. It is theoretically possible that a lens could be OK in all four corners and the center, but have a problem in the mid portion, but we’ve never seen it, and we’ve tested many thousand lenses.
As you probably suspect, instead of plotting out a graph we actually send the numbers to a computer program that compares them to the known acceptable level for that lens and gives it a pass-fail.
Not all lenses look quite as pretty as the one above. Below is a different lens, with different pass-fail criteria. This lens is a little weird, but the same principles apply. The center MTF is pointed to by the green arrow. The center MTF isn’t much higher than the off-axis MTF, which is normal for this lens (a telephoto prime).
You can see all of the off-axis points are to the right side of the center peak, showing this lens has field curvature. The solid and tangential lines are separated a bit, showing there is also a small amount of astigmatism.
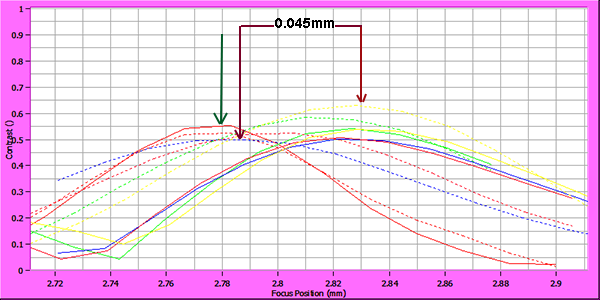
Olaf Optical Testing, 2018
But the most critical thing in this graph is that some of the dotted (tangential) lines are not focusing at the same place as the others. I put red arrows on the two that are furthest apart and measured the distance between them. (Again, the yellow peak doesn’t show very well, but the computer reads the numbers, not the graph.)
This shows a field tilt. This particular tilt only affects the tangential lines, not the sagittal, which is actually somewhat common. This is a pretty standard amount of tilt for this lens, and it passes easily. My point here is that we are checking the lens in 3 dimensions and getting numbers that show field tilt as well as absolute sharpness.
To give you a better idea of how it works, I’ve put thumbnails of 4 copies of a wide-aperture lens in the image below. The top two lenses are perfect. There’s the normal amount of field curvature (all of the off-axis graphs peak at a different place than the center but they’re together) for this lens.
The bottom left graph passes, but just barely. You can see the center sharpness isn’t quite as good, and there is some tilt in the tangential field, but it’s minor. The lens on the lower right fails because the tilt is very severe.
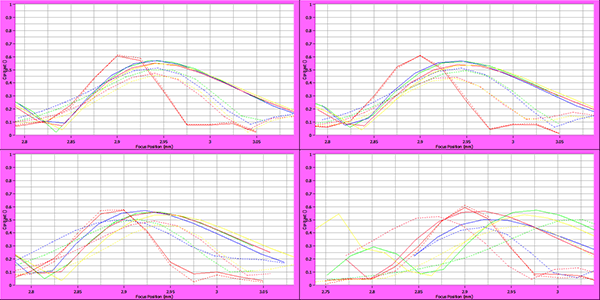
Olaf Optical Testing, 2018
I’m not trying to show you how to read these graphs, but rather just showing that when a lens isn’t right, it’s pretty apparent using this technique.
So How Good Is It?
We had three goals for this project: to test quickly, to test accurately, and to test the majority of lenses.
The quickness is good enough, although we hope to improve it more. It’s fast enough that we can use an optical bench for daily testing, which we could never do before. Of course, you have to buy an optical bench and have a lot of lens data to do that, but the improved accuracy makes it worth the cost in time and money.
The accuracy is superb. We tested hundreds of lenses using this technique during the debugging phase. Any lens that didn’t clearly pass got the complete one-hour bench test. In the above example, the lower two lenses both got the complete test, which confirmed that the lower left passed and the lower right did not.
It’s more accurate than our very experienced techs testing with the best chart setups made. The techs are about 98% accurate. The Rapid MTF test is about 99.5% accurate. But the important difference is the Rapid MTF test misses 0.5% by saying the lens fails when it actually passes. We’d much rather take 0.5% of lenses out of stock for further testing than to put lenses back in stock that shouldn’t be there.
We can’t test all lenses – yet. This was a trial run to see if the technique really worked (many people I talked to didn’t think it would). Setting it up was time-consuming; we have to write an automation script for each lens. If the lens comes in several mounts, each mount requires a separate automation script. (For those of you who’ve wondered why there haven’t been many blog posts lately, we’ve written and debugged over 200 scripts, tested multiple copies for each script, and then done the full long set of MTF tests on any lens that was questionable. It’s taken 2 of us working full-time for nearly three months to do that.)
Right now we’re using this technique to test all prime lenses; both photo and video. We’ll continue with just prime lenses for several months before expanding into other lenses. More software has to be written, more techs have to be trained to operate the optical bench, and workflows streamlined before we buy more benches and start testing zooms. We’re hoping some tweaks and improvements will speed things up a bit, too, before we order another bench and expand to other lenses.
We expect, though, that within a year this will be our standard testing for almost all lenses. I say almost all because there are some hurdles to overcome before we can do lenses of 400mm focal length and up, and some lenses with very small apertures (12mm f/4 zooms, for example).
Roger Cicala and Aaron Closz
Lensrentals.com
June, 2018
Addendum: I say didn’t quite make it in time because our experience is chart and projector testing are adequate for lenses that will be mounted to cameras up to the equivalent of about 30 megapixels full-frame resolution. When you put a lens on a 50-megapixel full-frame camera the charts and projectors become the rate-limiting factor; the chart tests can look fine, but a photo on the camera may show a problem the testing missed. I’ve written about this before.
Author: Roger Cicala
I’m Roger and I am the founder of Lensrentals.com. Hailed as one of the optic nerds here, I enjoy shooting collimated light through 30X microscope objectives in my spare time. When I do take real pictures I like using something different: a Medium format, or Pentax K1, or a Sony RX1R.
-
Michael Steinbach
-
Michael Parchomovsky
-
Roger Cicala
-
Roger Cicala
-
Roger Cicala
-
Lorenz Ammon
-
David Bateman
-
geekyrocketguy
-
geekyrocketguy
-
Brandon Dube
-
David Bateman
-
Brandon Dube
-
David Bateman
-
Brandon Dube
-
David Bateman
-
Brandon Dube
-
David Bateman
-
Y.A.
-
Astro Landscapes
-
Athanasius Kirchner
-
Roger Cicala
-
Roger Cicala
-
hjwulff
-
John Dillworth
-
Roger Cicala
-
Andre Yew
-
Roger Cicala
-
Andre Yew
-
Roger Cicala
-
Clayton Taylor
