We’ve spent most of the last month establishing a database of MTF curves and expected copy-to-copy variation for a number of lenses. Most people have a general idea about what we’re doing, can follow along the basics of MTF curves, etc. But many other people also have a very good question, “How much of a difference does it make when I put the lens on my camera and take a picture.” It’s actually quite difficult to just show you a picture. I can take MTF measurements of 10 or 15 copies and average the results and give you a range that you can expect. But I haven’t figured out a way to take a picture with 10 or 15 copies and average the results.
So today I’ll try to do the next best thing. I’ll show you how we use this data in-house to screen and adjust lenses. (That’s what we actually do all this for. We just post it on this site because a lot of people are interested.)
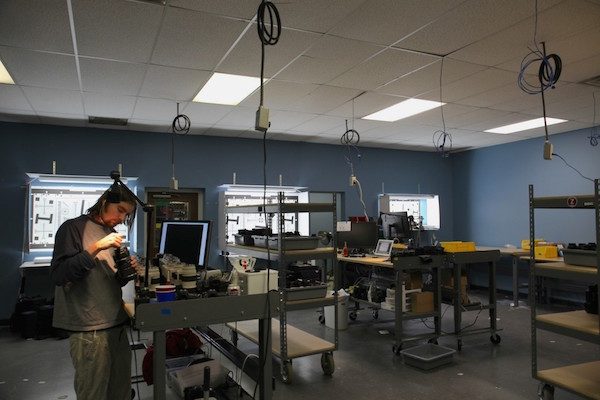
For this example I’m going to use a copy of the Zeiss 21mm f/2.8 Distagon. This particular copy had been in our rental fleet for about a year. After it’s last rental it was inspected and the tech noticed it was a bit softer in the corners than it should be and maybe just a little soft overall. He didn’t think it was awful, but noticeable when he shot an ISO 12233 test chart with it compared to other copies of the same lens.
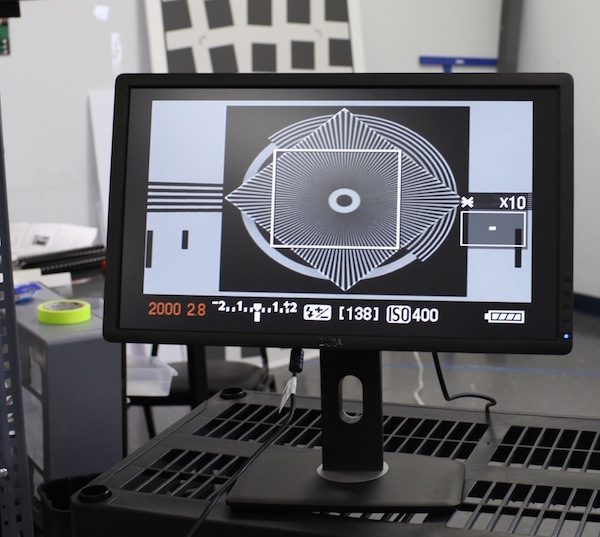
This is the same kind of testing a lot of people do at home or at their camera club. Nothing fancy, just take a well lined up picture of a test chart and look at the image on a decent monitor, comparing the centers and 4 corners.
Would you notice it in a photograph? I’m comfortable that if you took a few landscape or architectural images at f/2.8 you’d begin to notice the right side might be just a bit softer than the left. If you shot stopped down or only shot centered subjects, then maybe not. Or you might just think, “well, it’s a nice lens, but not as world-beating as they say online.” If you did the test for decentering I described years ago, you would notice the lens was very slightly decentered.
What We Expect the Zeiss 21mm f/2.8 to Look Like in the Lab
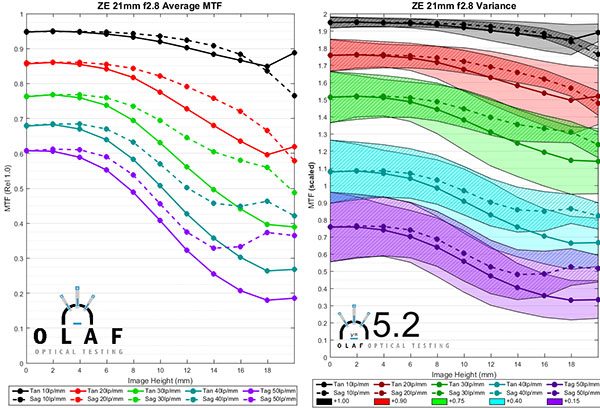
The inspection tech, of course, sent this copy over to the lab for some further testing. The first thing we did was pull up our reference charts for the 21mm lens (the same ones we showed you in an earlier post). On the left is the ‘average’ MTF curve of all Zeiss 21mm f/2.8 lenses we tested, on the right what we consider the range of acceptable results.
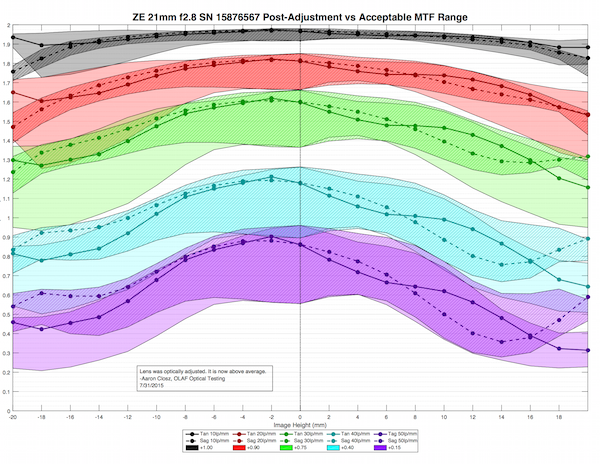
Then we put the lens in question on the MTF bench and compared it’s results with the expected range for that lens. (Unlike the reference graphs above, the working graph shows both sides of the lens.)
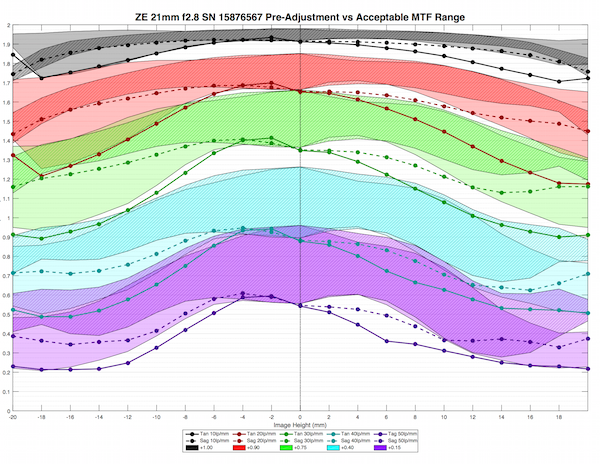
It really is just about as the tech described it: a bit softer than we’d expect, but not awful. It meets minimum standards right in the center but falls below accepted standards away from the center. The Zeiss 21mm is popular here in the repair department because when it does get out of sorts it’s easy to adjust; it’s usually just a matter of recentering the front element. Aaron did that and then we repeated the MTF tests.
It should be pretty obvious, but when the tech repeated his test images, the lens passed with flying colors.
For those of you who wonder if all these MTF charts have any real-world implications, hopefully this demonstration helped a bit.
Roger Cicala
Lensrentals.com
August, 2015

5 Comments
Somebody ·
Roger, as always, thanks for the posts. You (help) run a fantastic company, and of course, we all love that you’re open about how you run the business (or at least the parts we care about) & perform your tests. Thanks again!
Chris Jankowski ·
Roger,
I’d guess that your next challenge will be how to automate as much as possible of this now manual testing.
Hans Landheer ·
🙂 Love your blogs and how you guys love your work.
Learn a lot here to counter marketing myth and other blahblah. Keeping at least one foot on the ground is a good thing. Rental Business is also a very sound idea in photography.
(by the way, now big data is here and privacy has basically gone more than south. Could there be a pattern discerned in who thrashes their gear most? Sports, Wedding, Landscape, Event, Unboxing for Youtube, …. I just throw my 70-200+camera in a $15 Eastpak to lug around + the necessary food stuff. I love my gear, but it’s used, not cleaned, not pampered (sports). I’m always surprised how other people can ruin there gear way better than me :))
)
Zak McKracken ·
I do wonder: In the second graph, not just the measured lens MTF but also the “acceptable range” seems to be not symmetric. Is that supposed to be so?
Wouldn’t the expected range have to be symmetric even though of course most lenses aren’t? After all, you could imagine a borderline lens which only meets the criteria when rotated the right way, which does not seem to make a lot of sense… I had assumed that the expected range would just be the measured mean (plus minus some deviation) of MTF over distance from the centre, in whichever direction.
Roger Cicala ·
Zak, I’m glad you pointed that out – the range, was, apparently, including the tested lens in the averages. But there IS a little bit of variation in the averages when we do our 10 lens standards, particularly at the higher frequencies, especially with wide angle lenses. To get them down to perfectly even would probably take a sample size of 40 to 50 of the Zeiss 21mm, rather than the 10 we’ve tested.