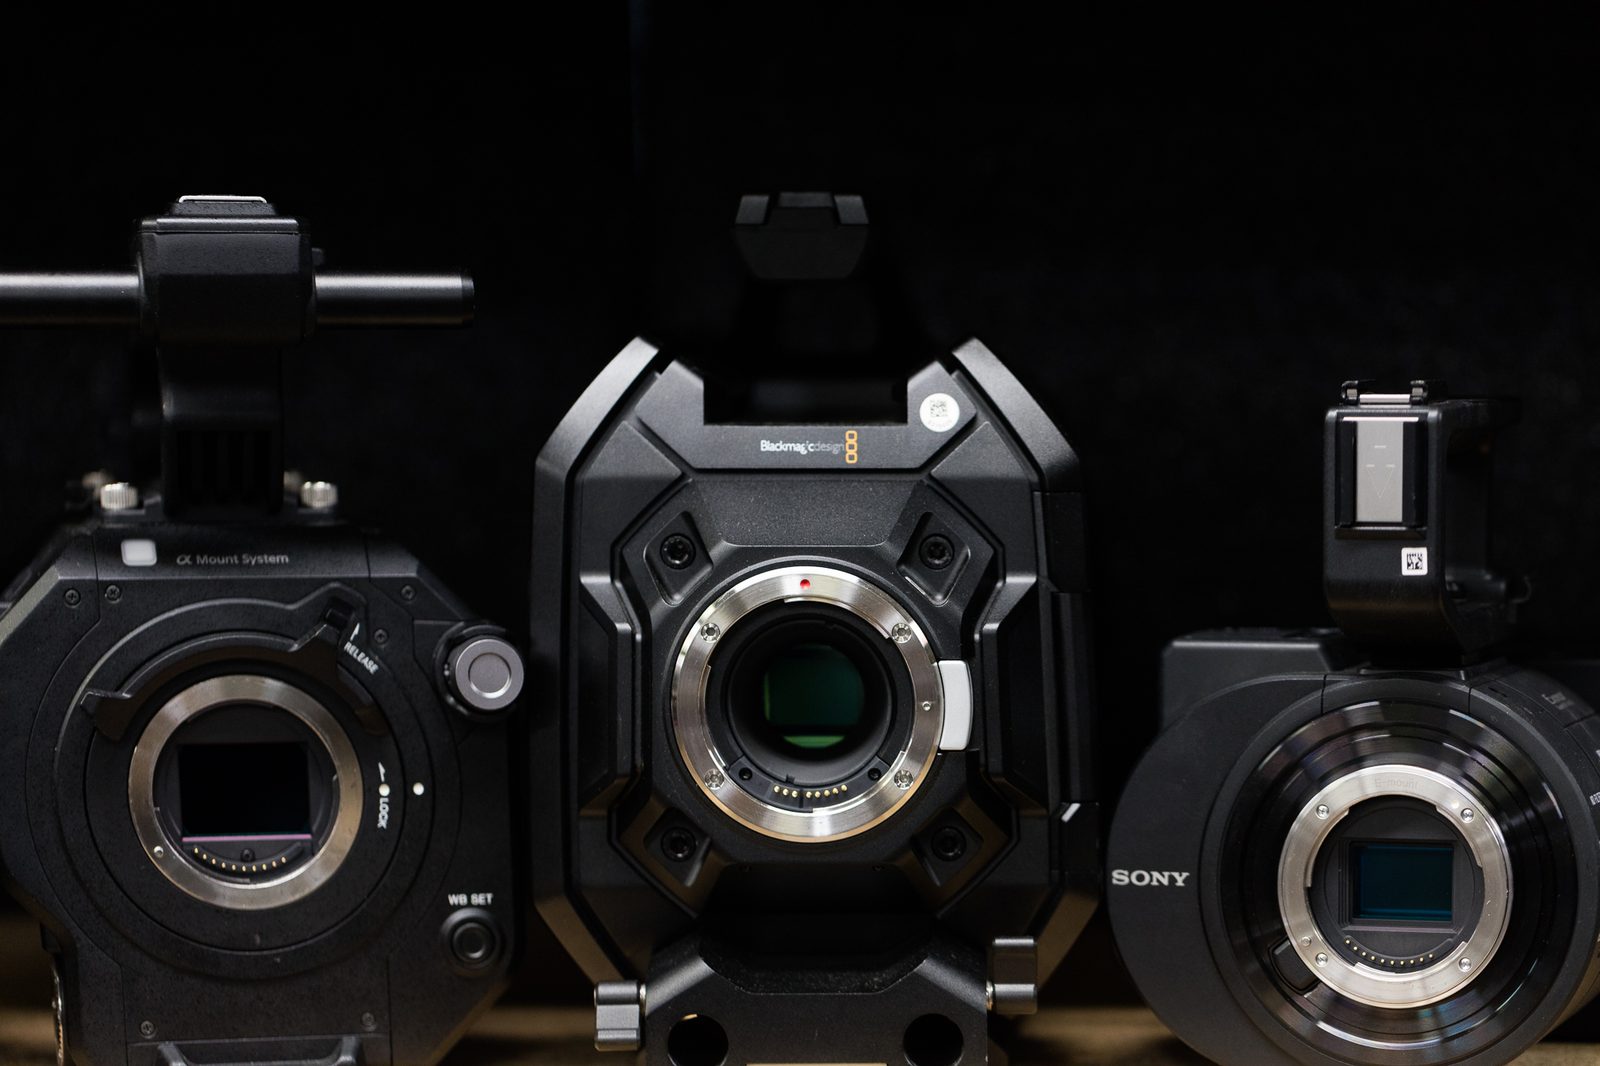
This is a guest post from Brandon Dube, whose name you’ve seen on many of our articles. In addition to his metrology work, he also does high fidelity numerical optical simulation, and spends his summers at places like NASA/JPL working on the cameras that are going in the Mars 2020 rover.
This may be our geekiest post ever, but it’s the only way we can address some questions that a lot of people have. What is the difference between lens MTF testing (like we do on an optical bench) and system MTF testing (like almost everyone else does with a camera and lens)? How do lenses fare when sensor resolution increases?
It’s also a very long post; meant more as a reference. It’s not something you’ll sit down and read in 10 minutes.
Introduction
Today I’m going to use physical optics and simulations to show how the MTF of the lens and the MTF of the complete lens-camera system relate. After that, I’ll discuss what happens when you use ultra-high resolution video sensors with lenses of varying quality.
This post will be filled with pictures. These are scientific pictures; the prettier you think they are, the geekier you are. All of the plots in this post are made with my Python open source optics module, prysm. You can view a Jupyter notebook with all of the simulations for this post here, too.
Simulating PSFs for Different Aberrations – The Lens MTF
The Point Spread Function (PSF) shows what a single point looks like after it has passed through the lens. The “Spread” in PSF means that a point never stays a point, even with the best lenses. (In these models, diffraction is naturally included.) Measuring how much the point ‘spreads’ is basically measuring the MTF.
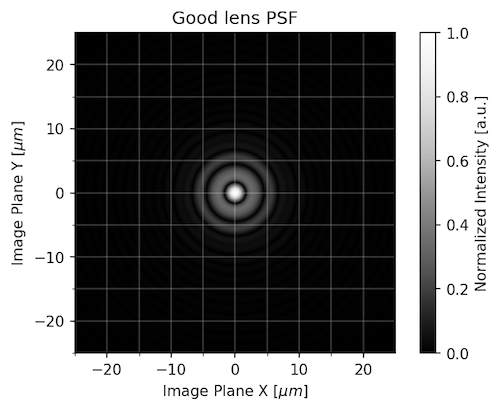
Instead of just giving you an MTF number (or PSF number), we can model different aberrations for a lens to show what the PSF looks like. First, let’s look at the PSF of a perfect lens 50mm f/1.4 lens (this exists only in theory, you can’t buy one).
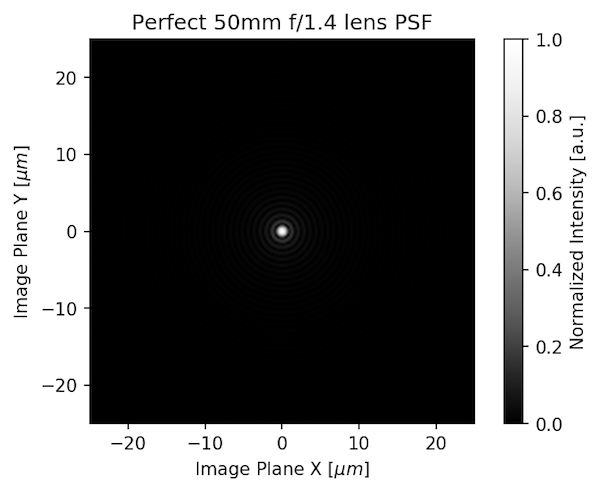
That looks like a point, doesn’t it? That’s because it’s theoretically nearly perfect, which real lenses aren’t. If we add some coma to the lens, the PSF would look like this:
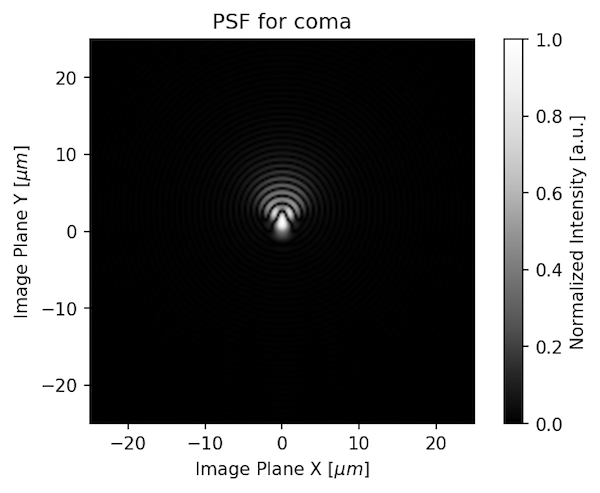
If the lens was astigmatic, the PSF would look like this:

If the lens that had both coma and astigmatism, the point would look like this:
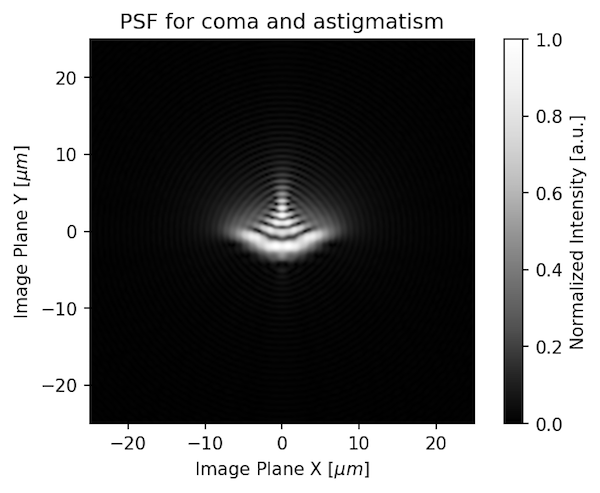
And if it had the same amount of coma and more astigmatism, it would look like this:
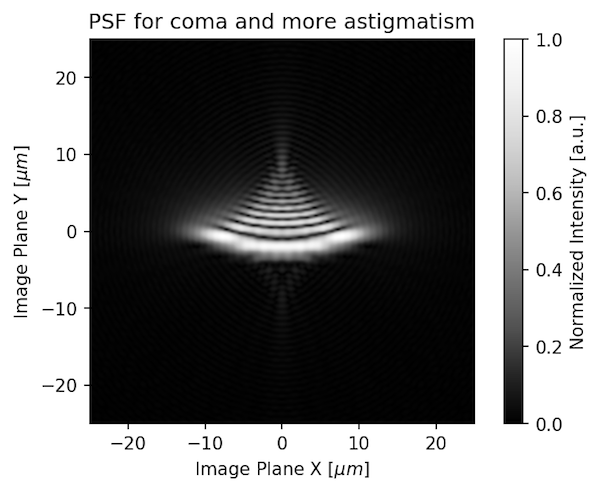
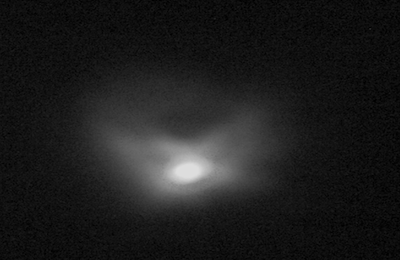
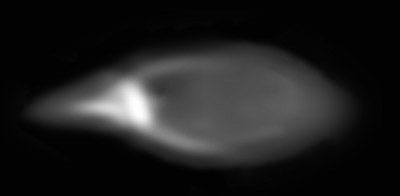
Of course a real lens has more than just 1 aberration; often about 8. A lens designer doesn’t let one aberration run out of control all by itself. Usually the aberrations balance each other. But they are always there to some degree. Here are a couple of real pinholes from fairly good lenses.
You can certainly see that the very first illustration would have the highest MTF and the others progressively lower MTF. But that’s when we measure just the lens.
Other Things Contributing to the System MTF
The system MTF is just the product of the lens MTF and sensor MTF (yes, the sensor isn’t perfect, it affects the image, too):
MTFsys = MTFlens x MTF sensor
Measurements made with Imatest, DxO, or other chart-based software give you the system MTF. In one way this is great, because it shows how the lens and camera perform together. In another way, it’s a real pain, because 2 years later when a higher resolution camera comes out you need to retest everything on the hottest new camera to see how the new lens-camera combination fares.
You can’t just assume the lens will be x amount better because the new sensor has x amount higher resolution. Two lenses may look equally great on a 24MP camera, but one might look much better than the other on a 50MP camera.
We have gone to great expense to acquire equipment that allows us to measure the MTF of just the lens without a camera. In one way this is a pain, because it doesn’t show how the lens performs on your particular camera. But, when you have tested the lens MTF in isolation, you can accurately predict the performance on any camera, as long as your data extends to a high enough spatial frequency.
The crux of this post is doing just that. It’s all simulated, but I’m good enough at simulating that NASA is trusting my models for a $3B rover on the red planet.
The Optical Low Pass Filter
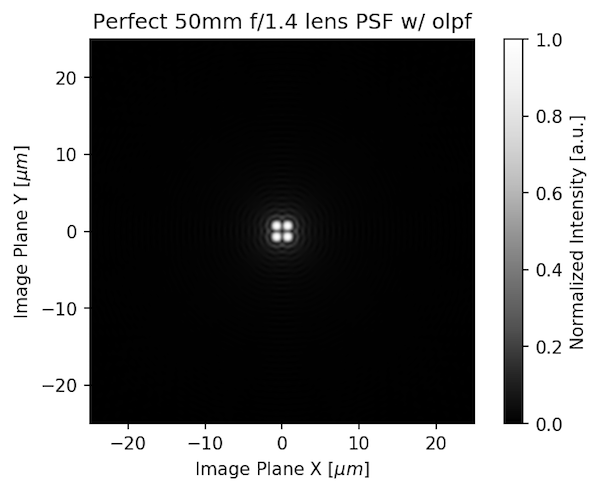
The sensor MTF has two key parts: the pixel size and the optical low pass filter (OLPF). An OLPF basically turns 1 dot of light into 4. If we take the PSF of that perfect 50mm f/1.4 lens we started with:

And convolve it (mathematically) with the OPLF, we get what the sensor is actually recording.
We tried to give you a real-world view of this by removing the OLPF from a sensor and photographing a 5 micron pinhole with and without it.
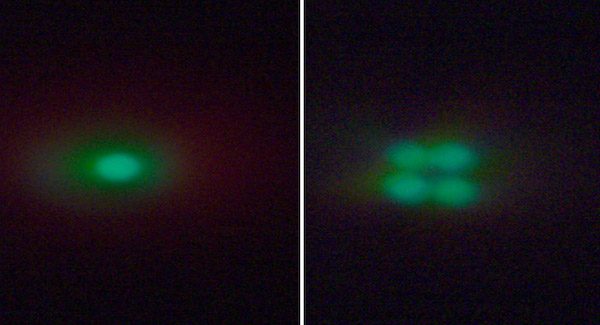
As you can see, the OLPF, just by itself, will decrease the resolution as seen by the camera compared to what the lens sends towards the camera. Some cameras have modified OLPFs, others none at all. The OLPF is necessary if the lens is “better than the sensor.” As pixels get smaller and smaller, though, it’s harder and harder to make a lens that’s better than the sensor and the OLPF is less necessary.
Pixels
The camera sensor isn’t made of round points, it’s made of little, square pixels. If we do one more mathematical convolution, introducing the pixels to the mix then we get an image that can be used to compute the system MTF.
![]()
To review, the above illustrations all showed what happens to a point of light as it passes through 1) an excellent lens, 2) the OLPF, and 3) onto the sensor and its pixels. The pinhole image from the lens (and its MTF) is a lot different than the image recorded by the camera (the system MTF).
MTF Measurements
Let’s look at how this would translate into an MTF measurement. The graph below isn’t the usual thing you see looking at one side of the lens to another. It’s evaluating how just this single point looks at different frequencies (finer details, if you will), for the lens, the lens and OLPF, and the entire system.
You can see that the MTF of the lens is spectacular (it should be, it’s theoretically perfect). The OLPF reduces the MTF mildly, and when you add the pixel (sensor) the MTF really drops. Not surprisingly, the MTF of this lens measured on an optical bench would be very different from the MTF of the lens measured as part of this system.
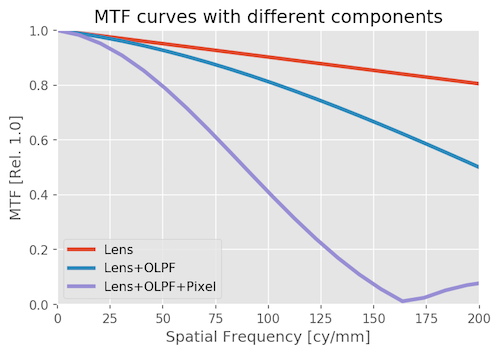
That’s for this example. The astute reader might realize that the white dot grew the most when we introduced the pixel. That’s because in this example the lens was a whole lot better than the sensor so the sensor had the most effect on system MTF. That’s not always the case.
If we have a less excellent lens, or a different sensor, things will be different. And that’s what we’ll discuss below.
So What Happens When We Change the Lens or the Camera?
OK, so we showed what happens to a point as it passes through the lens, then through the low pass filter, then as the sensor converts it to an image. Then we showed how the MTF readings changed while doing the same thing; from lens to system.
That was for a perfect theoretical lens. Now let’s look at more realistic lenses. We’re going to model a set of three lenses and five cameras and use MTF to evaluate the performance. The lens models we programmed include spherical aberration and simulation of the residuals from the polishing of the lens elements.
Let’s Meet the Three Lenses
Here are their point spread functions (the amount they blur your image) with grid overlays for 5 micron pixels:
The Best: An Excellent 85mm Lens at f/4
This excellent lens stand-in is very similar to the Zeiss Otus 85mm at f/4 in performance. In other words, one of the best lenses you can readily buy, at its best aperture.

A Good Lens: The Same 85mm Lens But Shown at f/2
This is modeled for how performance would be at f/2. Again, equivalent to one of the best lenses you can buy, but since it’s closer to its maximum aperture the point spreads more.
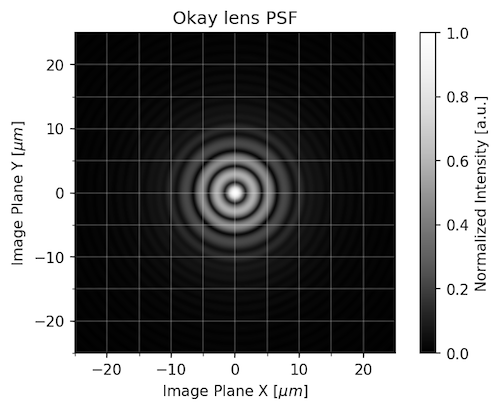
An OK Lens:
Finally, this model is similar to a low priced 85mm T/1.5 shot at T/1.5.
How Does This Relate to MTF (or how sharp my pictures are)?
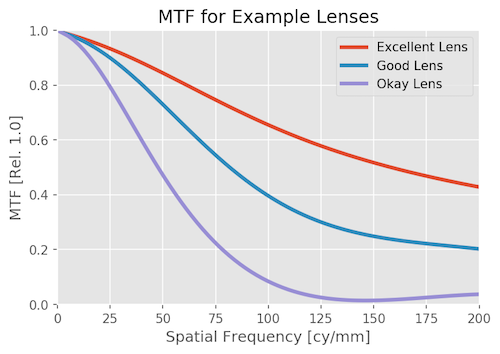
If you take the fourier transform of those point spread functions and do some normalization, we get a computer-generated MTF for each of our three lenses. This is once again MTF vs Frequency and only the lens. Higher frequencies are important for high-resolution cameras with small pixels and no OLPF; they can image that detail. Those high frequencies are pretty irrelevant for cameras with bigger pixels (1080p) and an OLPF.
That was just the lenses, as we would test on an optical bench. Now let’s look at the system MTF; the combination of lens and camera.
We particularly want to examine how the system MTF will change for the same lens at different sensor resolutions. For this example we’re going to make some generalizations. We’ll assume a Super 35 sensor size and calculate the following pixel sizes from different resolutions.
| Video resolution | Megapixels | Pixel size (microns) |
|---|---|---|
| 1080p | 2.4 | 11.6 |
| 3.4K | 5 | 7 |
| 4K | 8 | 5.8 |
| 6K | 20 | 3.8 |
| 8K | 36 | 2.9 |
System MTF with an Excellent Lens
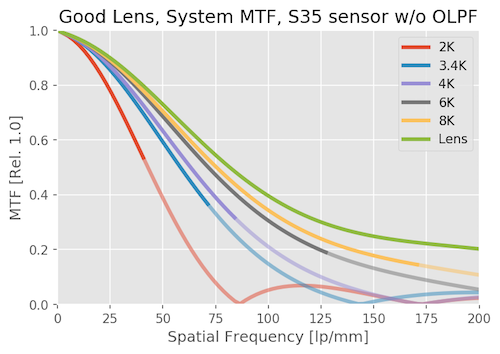
First we’ll look at how the System MTF varies with an excellent lens as you change camera resolution. We’ll do it without an OLPF first, and then look at the effects of the OPLF second.
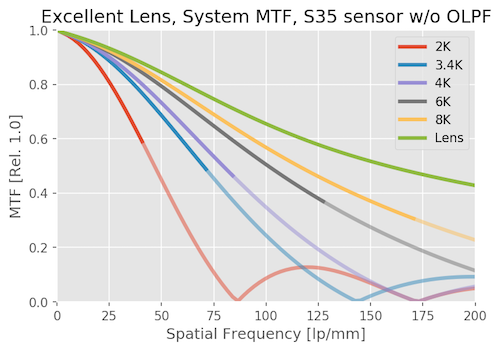
The green line is the MTF of the lens itself. The red line is what a 1080p system can resolve with this lens. In between, you see that higher resolution systems get closer and closer to the lens resolution.
The 3.4K (blue) and 4k curves have higher MTF, and extend to further frequencies than the 2K curve by quite a lot. Both are a big step up in resolution from 1080p, obviously, and 4K is only slightly higher than 3.4K as you would expect. As we continue, 6K is much better than 4K. 8K is better yet, but we’re starting to slam head-first into diminishing returns; it is improved over 6K, but not by all that much.
There’s another part of the graph that’s important; the Nyquist frequency. This is the highest frequency that can be accurately captured by the sensor. The higher the resolution of the sensor, the smaller the pixels, and the higher the Nyquist frequency. For these sensors, the Nyquist frequencies are about 43, 72, 86, 130, and 172 lp/mm, respectively. In the graph, each line becomes semitransparent beyond the Nyquist frequency for that sensor signifying the camera really couldn’t resolve that.
If the MTF is higher than 0.2 at the Nyquist frequency, then aliasing can occur. In the example above, the 1080p sensor has an MTF of nearly 0.6 at Nyquist; it is very likely to show aliasing. The higher resolution sensors have lower MTF at Nyquist and are less likely to show aliasing, although it’s still possible.
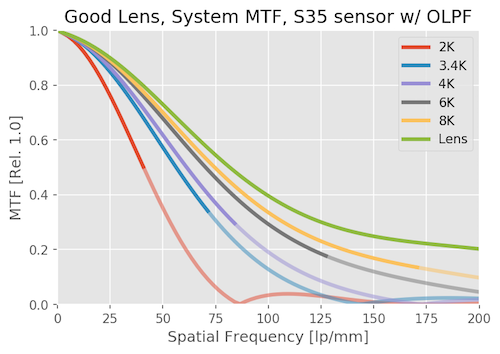
That is why OLPF filters are used. If we drop in an OLPF of “standard” strength (see e.g. Frans’ work here) it will reduce aliasing. Here’s what the same system would look like if we add an OLPF filter.
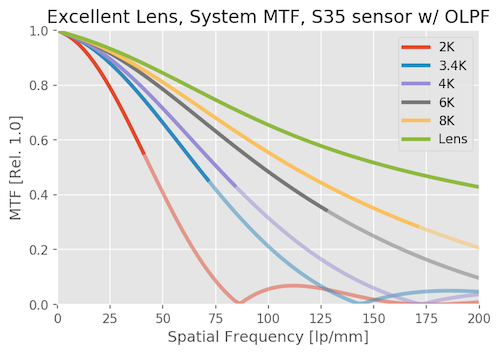
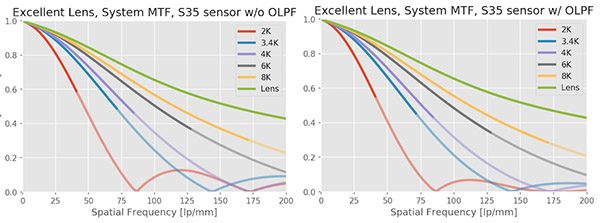
You can see that up to Nyquist for any sensor, the OLPF only reduces the MTF slightly, but beyond Nyquist it’s working to push the MTF down, making aliasing less likely. To make the comparison a little easier, I’ll compress the two graphs above so you can see them side by side. Notice how the MTF bumps, which reflect possible aliasing, are reduced. It’s most noticeable at the frequency of about 125 lp/mm in the 2k curve and out at 200 lp/mm in the 3.4K curve.
System MTF with a Good Lens
With a good lens, instead of a great lens, the MTF of the system drops significantly. Notice, though, that the 2k system really doesn’t change much; you don’t see much difference when you change from a great to a good lens at that resolution.
On the other hand, improvement in sensor resolution makes less of a difference with the good lens, especially at the highest resolutions. There’s still a big difference between 1080p and 4K, but less change between 4k and 6k, and not much change between 6K and 8K.
There is still some aliasing (look particularly around, say, 125lp/mm for the 2K sensor). It’s less severe than it was with the excellent lens, though.
The OLPF still cuts down on the aliasing, but the lens is starting to do that job for us at 3.4K and higher.
System MTF with an Adequate Lens
With just an OK lens, the resolution of the sensor makes a lot less difference than it does with a good lens. Increasing camera resolution makes far less difference in the system MTF. 6K and 8K are hardly distinguishable. Even the 2k resolution is lower than it was with a good lens.
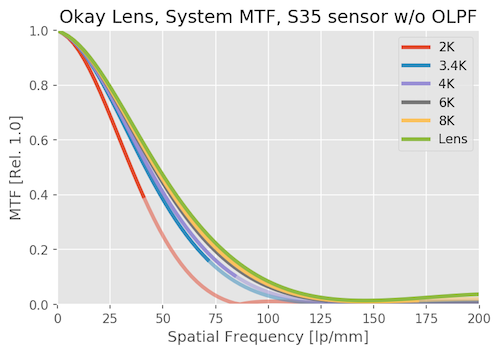
We hardly notice the OLPF effect on this system, the lens is doing most of that job for us. Lenses that are much better than a sensor need OLPFs, lenses that are worse don’t.

So What Did We Learn So Far?
Pure lens MTF (the optical bench) shows you the upper limits of what the lens is capable of.
System MTF shows you how the whole system resolves the image.
For an exceptionally good lens stopped down a bit, then the system MTF is almost entirely dependent on the camera. Raise the resolution of the camera and the image improves dramatically.
For average and poor lenses, the system MTF is limited by the lens. Changing cameras makes only a small difference.
For most lenses the system MTF changes significantly with different sensors, but at higher resolutions a diminishing return is seen.
Optical low pass filters are necessary on low-resolution sensors, but not as necessary on high-resolution sensors. If you do see aliasing on a high resolution sensor, you can bet that lens is damned good.
There are some practical messages that are worth emphasizing.
System MTF on a low resolution sensor (1080p for example) is not a good predictor of how that lens will behave on a high resolution sensor. For video folks this means a lens that was great for 1080p may not be very good at 4k. For photo folks, don’t look at system MTF tests on lower resolution sensors.
Only the very extremes of lenses are so good or bad that you can make a blanket (blanket – from the Greek ‘blankus’ meaning clueless) statement that a lens resolves a certain number of megapixels. Yes, an Otus stopped down to f/4 will outresolve a 32 Mpix sensor, but not a lot of other lenses do. And yes, a $600, 10X zoom probably won’t resolve more than 16 megapixels even if you put in on a Canon 5Ds. But almost everything else will give a system MTF that changes to some degree with both sensor and lens.
Finally, you can use pure lens MTF values to get a good idea as to how the lens will perform at a given resolution. The rough rule is higher resolution sensors can ‘see’ higher lp/mm MTF. If you’re shooting 8k or high resolution photo, you need to look at the 40 and 50 lp/mm curves. If you’re shooting 1080p, all that matters are the 10- and 20 lp/mm curves. I’ll get into that in the addendum, but you probably want a break before tackling that.
Brandon Dube
Lensrentals.com
October, 2017
Addendum: Tracking System Performance for Each Lens
For a lot of people, the above makes sense, but you’re left wondering ‘how much will I notice that?’
Let’s look at the system performance, but instead of graphing it by MTF, let’s look at it as a function of image quality with magnification in Lightroom, Photoshop, or any other editor. To do that, we’ll look at the Nyquist frequency (the highest detail each sensor can resolve), from the full MTF vs Frequency plot.
Please pay equal attention to 25% and 50%, not just 100%. For your 8K video, how many of your viewers are watching on 8K screens with their nose touching the display? If the answer isn’t “most” and you aren’t doing a lot of cropping or have other use for the pixels, then looking at the image at 25% and 50% of full magnification is more realistic than 100%.
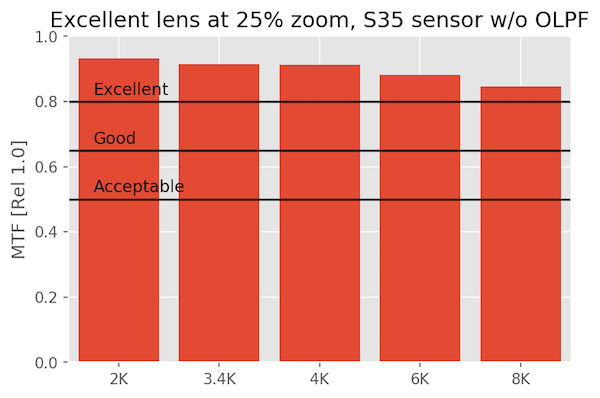
In the graphs to follow, I put a line at the MTV showing what I consider “Excellent,” “Good,” or “Acceptable” performance. My standards are quite high, and “acceptable” is not synonymous with “bad,” it’s…acceptable. You may have your own criteria that is different. You can mentally slide the cut-off bars around to what you think is right.
An Excellent Lens on Various Sensors
At 25% magnification
When we look at our excellent lens at 25% zoom, there are no surprises and it looks excellent everywhere, even on 8k video.
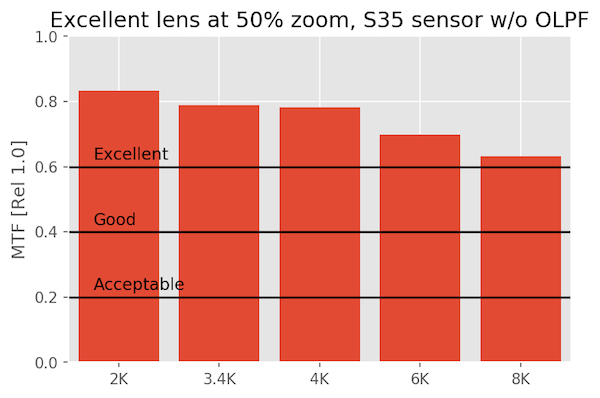
At 50% magnification
When we zoom in, things are still looking great.
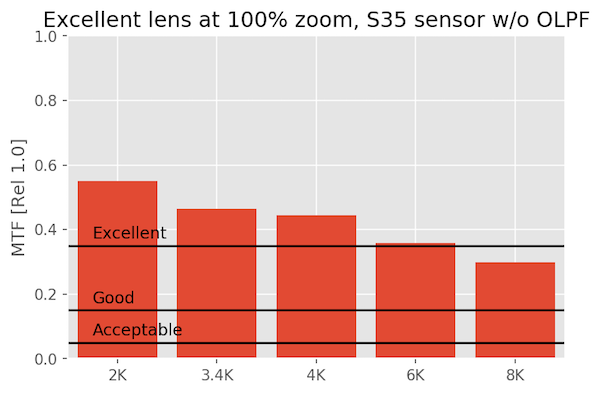
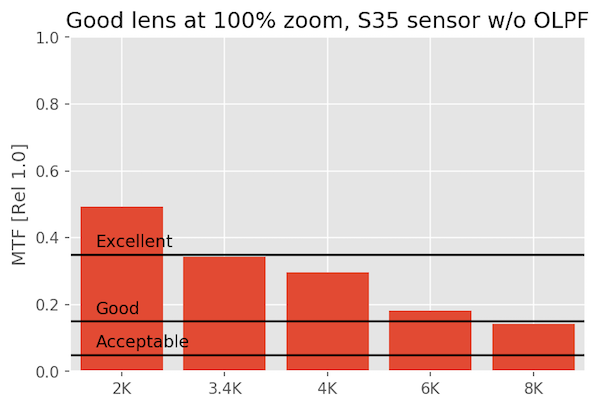
At 100% pixel-peeping magnification
Zoomed all the way in, you’re going to need an incredibly good lens to meet my standard of excellence at 8K on S35. Is 100% magnification a realistic thing to look at? Probably not unless you are cropping pretty hard. But even then the lens is almost excellent.
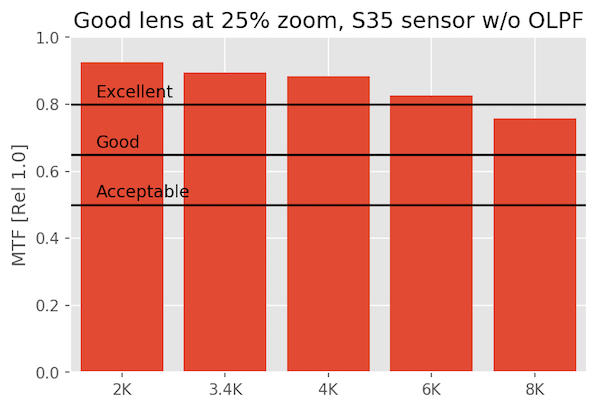
A Good Lens on Various Sensors
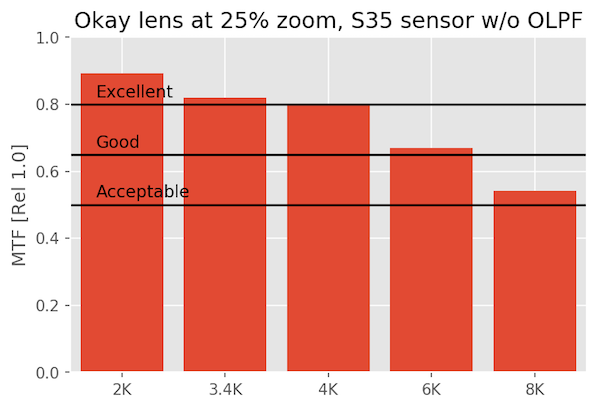
A ‘good’ lens shows some differences, particularly at 8k, but unless you’re cropping or manipulating the image so much that your doing something equivalent to 100% pixel-peeping, it’s, well, good. At 4k you won’t see much difference from 8k unless you zoom in to 100%
At 25% magnification
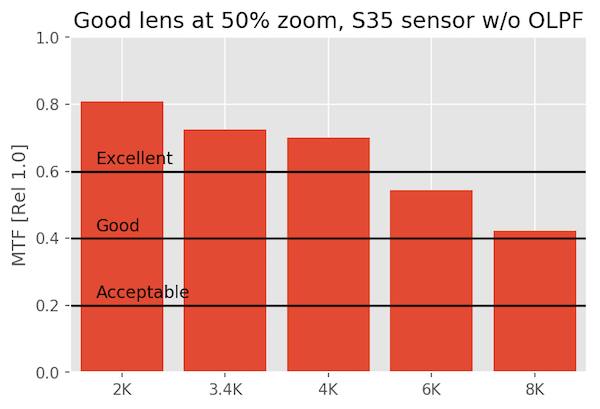
At 50% magnification
At 100% magnification
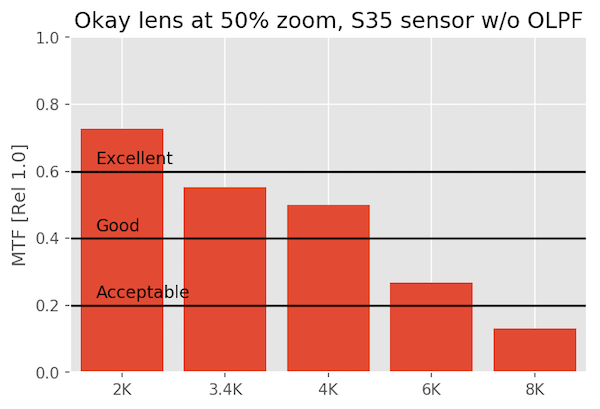
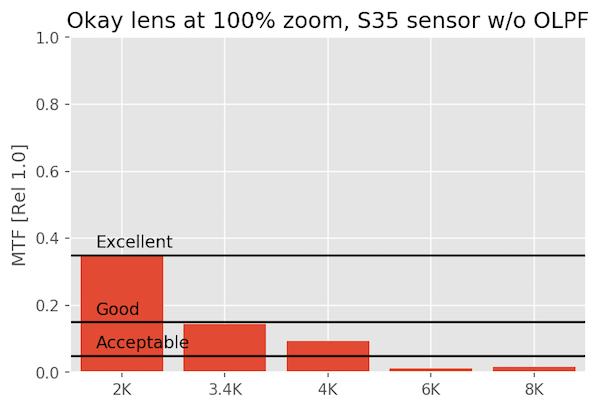
An OK Lens on Various Sensors
The okay lens just isn’t made for this kind of scrutiny, and fails to even be excellent at 6K or 8K. But it’s perfectly acceptable at 1080p and 4k. It’s rather a waste on an 8k sensor.
At 25% magnification
At 50% magnification
At 100% magnification
One Last Picture
Since you may be more used to this, here is what our excellent (left) and OK (right) lenses would look like if you took a Seimens Star chart image at 8k and 100% magnification. If you did it on a 1080p camera, they’d be nearly identical.

So What Else Did We Learn Today?
We used physical optics to model the performance of lenses, and examples of lenses on different Super 35 video camera sensors. We saw that an “okay” lens works great at 2K, and is pretty good at 4K, but it does not so work well at 8K. A “good” lens might hold up pretty well at 8K, at least in the middle of the frame. We also saw that an “excellent” lens is still not perfect when put in front of an 8K, Super 35 sensor at high magnification.
This implies that maybe 8K can be wasted, or at least the limit, for a Super 35 sensor size. You may need a VistaVision or larger sensor to really capture that kind of resolution unless you’re shooting with an excellent lens stopped down a bit. Of course, there may be very real reasons to use 8k other than absolute resolution. And even if the image is a little soft at 100%, is that such a terrible thing?

62 Comments
Ed Hassell ·
Guess this means my venerable 43-86 Nikkor zoom is unlikely to do my D850 justice. Shoot! Seriously, great article.
geekyrocketguy ·
In your “Excellent” / “Good” / “Okay” lens PSF comparison, why does the FWHM of the PSF core remain the same, even though the aperture is changing? You’re basically showing more power going into the wings, but shouldn’t the core size also change?
Brandon Dube ·
The modeled lenses have aberrations, it is not just diffraction. They are all for an f/4 simulation, and the “Good” and “OK” lenses are highly aberrated, to the point that their f/# does not really matter.
Chris Newman ·
Thanks Brandon for your prompt reply, and for confirming where my D800 fits in your modelled curves.
I appreciate that you were unlikely to know the strength of the D800 AA filter, as you’d already made that response for the Canon 5Ds.
Knowing very little about video, when I saw references to a 50mm
f/1.4 lens, “Super 35 sensor” and 36 MPx, I thought your model 8K sensor might be a close match for my “35mm full frame” D800. When I Googled “Super 35 sensor” and 8K video, I soon realized it was physically smaller, but it seems I found a different type of 8K to that you modelled, with a different pixel count to that in your chart, and the information I found didn’t acknowledge that there were other types of 8K. You explained this, but, probably as a result of that digression, I’m still uncertain how, and to what extent, your modelling can be transferred to other sensors. Your System MTF curves are labelled 2K, 3.4K, 4K, 6K and 8K. If I was to mentally relabel your 3.4K, 4K, 6K and 8K curves as being for 7µm, 5.8µm, 3.9µm and 2.9µm pixel pitches (and does 1080p = 2K = 11.6µm?), would these
curves apply to any Bayer sensors of those pixel pitches (with “standard” strength OLPF if included)? Or will other sensor parameters, such as overall size or pixel count, prevent such straightforward comparisons?
With thanks, Chris
bokesan ·
Pixels are square? What about the microlenses, especially in gapful designs such as the Fuji GFX? Wait, you already wrote about that: http://blog.kasson.com/the-last-word/discovering-the-fujifilm-gfx-50s-microlens-size/
But is the shape of the pixel relevant in any way (just square or round – I don’t want to know about star shaped pixels or wierder things)? Or does it just boil down to the fill factor?
Frans van den Bergh ·
All the system MTF plots above were for a given orientation relative to the sensor, e.g., the horizontal direction/along the rows in the sensor.
If your pixels are square, then that system MTF will change a little bit as you change the orientation from horizontal through to 45 degrees (through the corner of the ideal square pixel). This difference is small, but measurable; I would guess less than 5% based on my own simulations.
Round pixels would be better in that regard, delivering the same resolution in all relative orientations, but I get the impression that “real” pixels with microlenses are square with rounded corners, just waiting for Apple to sue.
Brandon Dube ·
Square pixels. If you want something more specific you can always make a PixelAperture class that is nonsquare, and prysm will compute the full 2D PSF/MTF if you want.
A “Pillow” shaped pixel will perform worse along X/Y than a square pixel of the same nominal width.
Matt Grum ·
The shape of the pixel is relevant when it comes to the sensor MTF – the sensor has higher MTF in the horizontal and vertical direction than it does in the diagonal directions (think about it the width of a pixel is smaller than its diagonal, hence there are more pixels per mm when measured horizontally/vertically).
Frank Neulichedl ·
Thank so much for this great post. I just wonder how much this would be applicable to smaller sensors – like really small ones used in todays 360 cameras.
The interesting part about 360 video is, that people actually look at it 100% and very close, cause you just see a fraction of the video.
Does it make sense to go to 5.7 or 5.2k if lenses they use (Gopro or Garmine for example) are just “good” on small sensor with a pixel size of 1.55 um ?
Brandon Dube ·
Small, very high volume systems are a different regime compared to cinema stuff. E.g. a GoPro is largely plastic, double sided complex aspheres like a cell phone. Imagine how good your camera lens could be given 10 aspheres – that’s the world GoPro, etc, are playing in.
“Good” is not bad. I commented on this in the post — of course everyone wants the best, but you don’t need the best. Even Acceptable on the barcharts I made is, well, Acceptable. Acceptable != Bad.
Frank Neulichedl ·
Thx – I just need to decide (for me) if it is worth to spend double the amount to jump from 4k to 5.2k – especially if considering the reduced field of view of a 360 video.
Matt Grum ·
What about demosaicing? A camera which records full colour at each of the say 2 million pixel locations (e.g. a 3-CCD design) produces a noticeably sharper image than a Bayer sensor that only records one colour per location.
Is that taken into account with the size of the pixel PSF? If not how would it affect the result if it was taken into account?
Brandon Dube ·
The pixel is the pixel, regardless of the color filter on top of it.
Demosaicing is a nonlinear process and thus dependent on the input – I did not model it.
Imagine a white test chart. After you rebalance the raw R and B pixels to be equal intensity to the G, you have a uniformly spatially sampled, and Bayer cost you nothing.
Now imagine the same chart painted red. There is no way to get information from the G or B pixels, so you will always have bad sampling.
The minimum impact from bayer (None) is for something white. For something purely red or blue, the impact is greatest. The average impact is somewhere in between.
It is impossible to make a single model for all scenarios, and doing it would just add noise to an already very long post.
Athanasius Kirchner ·
That’s enlightening. I had never thought about demosaicing in that way.
SIMONE PIETRO SARAGOSA ·
Great article, thanks for the write-up!
Also the prysm module appears to be a interesting piece of software, I’d like to test it a bit but docs are pretty scarce …
Brandon Dube ·
There’s something like 34 pages of docstrings. If you clone the source and rebuild the docs, you’ll get the sphinx reference. There’s also a bunch of samples showing use cases. Anything you find particularly lacking?
SIMONE PIETRO SARAGOSA ·
True, I didn’t check the docstrings yet. I was look for a doc in the github repository.
Very interesting software…
Brandon Dube ·
It has some fancy features. If you feed it e.g. a PSF and a pixel aperture to convolve, it doesn’t care whether they are equally spaced or not — it will do a resampling in the fourier domain where the functions are smoother, or just use the analytic fourier transform if that is a part of the class.
I need to add an image simulation example, but it is straightforward. Import a grayscale or RGB image from a file and use img.convpsf to blur it.
alek_komarnitsky ·
WOW – great stuff Brandon … or I’m thinking we should be calling you Dr. Dube! 😉
Matt Grum ·
Well B.Sc (or is it B.Eng?) Dube at the very least, I don’t think Brandon has submitted a doctoral thesis… yet 🙂
Brandon Dube ·
I don’t have that degree either!
Brandon Dube ·
I really don’t care for titles – Brandon is just fine 🙂 (I also don’t have a PhD) Glad you liked it!
Alek Komarnitsky ·
WOW - great stuff Brandon ... or I'm thinking we should be calling you Dr. Dube! ;-)
David Bateman ·
This was great, but took me 20minutes to read straight. The other way to look at it is to buy an ok lens that your happy with on your current camera. Now your done, no more camera purchases as you will not see any great improvement. This will save you lots of money, assuming the newer cameras just have higher resolution and that your “happy” camera never breaks. If it does break, then you will need a new ok lens for that camera, assuming the pixel count increased.
Ummon ·
Thank you very much for this post – this was not lengthy at all. Unfortunately, I was not able to extract from the addendum the information to which lp/mm mtf curve I would have to look given a sensor with defined pixel density with/without filter.
So, with some assumptions and probably harsh simplifications – can you perhaps make some suggestions as how to translate a lens mtf into a recommended/minimum Sensor?
( As in: “A lens which achieves a 50 lp/mm of xx warrants a sensor with Pixel pitch of yy with/without filter” ).
Roger Cicala ·
Brandon will come along and put accurate numbers to this, but as rough thought 1080p really just lives in the 10 and 20 lp / mm area. When we get up to 8k video (and the smallest pixel-pitch still cameras) 50 lp/mm probably isn’t quite enough. We’re probably going to increase our MTF charts to higher resolution for that reason. Fair warning, though: everyone’s going to lose their mind when we do. Copy to copy variation is greater at higher resolutions.
Ummon ·
That´s very nice to hear, looking forward to further information from Brandon and getting my mind blown a bit by higher-res tests =)
Ummon ·
That´s good to hear, looking forward to further information from Brandon and getting my mind blown a bit by higher-res tests =)
Brandon Dube ·
You can’t really use a single frequency to tell yourself much of anything, and a lot of cameras (e.g. A7rII, D850, 5Ds/R) can “see” at least 100lp/mm. I would say if you see an MTF at 50lp/mm of 0.5~0.6 or higher, then the image will probably look ok/good on that class of camera.
I might do a followup post here I use just diffraction to blur things and let people look at what kind of MTF they want at nyquist, half nyquist, etc, for an “acceptable” image. Someone on reddit commented on this article that their 24-120 was great on the D850, and that combo would probably fall quite far below my “acceptable” threshold drawn in this post.
Mika Foxx ·
I put the 24-120 on my d610 and I swear I thought the lens was broken. Thing is unacceptable in most of the range, at most of the apertures, even in the center. One reason I switched to primes pretty much.. and Sigma’s Art lenses second hand sure fill me with joy.
My gramps worked in broadcast and his first response to the megapixel wars were “Can the lenses even resolve that?” Those big Angineux 10x zooms cost a pretty penny and resolved like, Full HD well enough?
Max ·
Great post!
SolJuJo ·
Brandon, the last pictures do show a Siemens star. See https://en.wikipedia.org/wiki/Siemens_star
It it has to be a geeky article, perfection is the least we can ask for. :))))
Thanks a lot for your insights.
Brandon Dube ·
Surely you know how this blog works? Nothing goes up without a typo or two or fiev!
SolJuJo ·
Yeaaah, we need some reason to read it. :)) *offandhuntingformoretypos* if not for yours than for mein. ;/
Roger Cicala ·
Well, that was my typo. I kind of think of the typos as my contribution.
SolJuJo ·
Your typos are as well and clever made as your articles. It would not be the same without them! Thanks so much for your work and the pleasure to read it.
🙂
HF ·
I like it!
Ally Aycock ·
Oh Brandon, we sure do miss you! Thank you for taking time to address the total system approach to evaluating image quality.
Søren Stærke ·
As an optical engineer I loved this article. I was not surprised over the results as I’ve worked lots with physical optics myself, but I liked the very graphical way it was presented. Good stuff 🙂 btw, give me a heads up if NASA needs more people in their optics department 😉
Carleton Foxx ·
The preface: My degrees are in English so I’m not remotely qualified to participate in this discussion, but here goes: My own experiences have shown me that you can never have a lens that’s too sharp; when I rented the Zeiss 135 and put it on my 10MP, million-year-old Nikon D200 I was transported back in time to the age of miracles—a whole other realm of subtlety and beauty (thanks for that LensRentals). The same thing happened recently with a borrowed 50mm manual focus Nikkor—my friend owns one of those 1 in a zillion copies of the lens that’s so exceptional it’s like Koyata Iwasaki himself did the assembly.
The actual question: Based on my own experience of putting an extraordinary lens on an average camera, are we sure that 20 lp/mm is really enough for 1080p, 40 for 8K and so on? Or is it more just that we haven’t come up with a sensitive enough measuring system to tell the difference? I understand false detail, but to my eye, it looks like there’s more than just an optical illusion going on when you use better lenses.
Greg ·
10MP on a 4×3 sensor is roughly equivalent to 4k on a 16×9 sensor. Based on these results, at that resolution a discerning eye should be able to tell the difference between a good lens and an excellent lens at 100%, and between an okay lens and a good lens at 50%.
Brandon Dube ·
The nyquist frequency for the D200 is around 80lp/mm. How relevant information at nyquist is, especially for a bayer sensor, is a bit of a separate (and lengthy) discussion. Half and quarter nyquist (40, and 20lp/mm in this case) will always be relevant. SMPTE’s guideline, which I find obscenely high, is 80% MTF from the lens at half nyquist. You will find very few lenses with 80% MTF at 40lp/mm.
Something by definition removed from MTF is veiling glare, or the overall contrast level of a lens. Nikon’s 200mm f/2, for example, is famous for having enormous veiling glare, and low contrast, when shooting strongly backlit subjects. An excellent lens will tend to have less veiling glare and thus a more contrasty image that is usually preferred by viewers.
The sensitivity to a difference in MTF of a viewer is also pretty good. A difference of about 0.1 is usually perceptible, and for example the difference between my “excellent” lens and “good” lens here is around 0.08. The ZE 135/2 APO is reasonably similar in terms of MTF wide open to my “good” lens, and the difference between that and the ‘acceptable’ one is also 0.1ish at 40lp/mm.
Different aberrations are more offensive than others as well. Chromatic aberrations and astigmatism are probably the most offensive, where e.g. spherical aberration is quite benign, and at times even desired.
David Alexander ·
Really stellar article, much enjoyed.
Lo-Wok Li Ya ·
Brandon, thanks for a superb article!!!!
I’ve made some similar things, namely I got PSF or Airy disk pattern out of some LOMO lenses and then tested them making real photos at 6K. That connects PSF (bad and good) to the real-world lens performance here http://goo.gl/Ahh9nv
Brandon, where can I get the Prsym? Is it a simple executable or a lib for complex compiling?
I just have a need to calculate MTF out of the PSF image like that attached: https://uploads.disquscdn.com/images/d3be131d84384ecb2187ce8a5833c756450f9bb9416cdff063ab3cb51293c8c0.png
Brandon Dube ·
Prysm is a python library. You can clone the source repo – https://github.com/brandondube/prysm – or just do `pip install prysm` in your command line.
The repo probably has the CUDA-based FFTs enabled by default, and I have not gotten around to making it something that can be changed at runtime. You need to also have pyculib installed to enable computation with an nVidia GPU. If you don’t have one, or it is too old, you will need to go into /prysm/config.py and change _backend to ‘np’ in the global variable, and in the class constructor as well.
Once you do that, you need to make a PSF object. You need a 2D array of data, and a sample_spacing parameter. The sample spacing is the pixel pitch in the image. If there is a microscope or other enlarger used, you need to use the pixel pitch of the camera divided by the magnification of the objective.
You would do:
from prysm import PSF, MTF
# somehow get your data into an array. Probably 3D. (RGB images are inherently 3D)
# you have to collapse it to 2D somehow. You could do the R,G,B MTF independently, or do the more realistic
# polychromatic MTF by doing something like the sum along the color axis.
your_psf = PSF(data=2d_array_of_data, sample_spacing=your_effective_pixel_pitch)
your_mtf = MTF.from_psf(your_psf)
an MTF object has methods like plot2d, plot_tansag, etc. You can also use the .exact_xy and .exact_polar to get the MTF at particular frequencies and azimuths.
PSF objects are supposed to have their data be normalized from [0,1]. There will be no consequence for MTF computation, but e.g. PSF.plot2d() will not look right with unnormalized data.
Lo-Wok Li Ya ·
Brandon, thanks a lot for this thorough guide!!!
Brandon Dube ·
There is no manual, but if you `cd` into ~prysm/docs and do `make html` or `make pdf`, etc, sphinx will build the docs with whatever output format you want.
prysm is a library, it contains no scripts (“recipes”), only pieces of machinery to perform simulations.
The github repository contains a number of examples.
Lo-Wok Li Ya ·
Aha, I see which is pity I’m not capable of using it.
Sorry for taking your time. Wish you luck!
dericali ·
Blanket is not a ancient Greek derived word, rather Middle English.
Roger Cicala ·
I used alternative grammer.
dericali ·
alternative entomology, perhaps
DrJon ·
I see someone already commented on the blur (or whatever you want to call it) due to the Bayer filter commonly used so I’ll skip that, but I was interested to compare your OPLF effects with the noticeable change Roger saw comparing the 5Ds/sr in some cases (using an Otus not at one of your aperture choices). Are they in loose agreement or is the range of AA filters too large for models to be that relevant?
P.S. I quite liked this on AA filters:
http://www.strollswithmydog.com/resolution-model-digital-cameras-aa/#more-1723
Brandon Dube ·
I have no idea how strong the AA filter in the 5Ds is. A sufficiently rigorous test to find out is quite complex, and complexity=time=money.
In the future we may offer some fancy ways of looking at data that depend on knowing that, in which case we would measure it and find out. But that is not certain and certainly not done today.
Chris Newman ·
Thanks Brandon for some really useful information. But I have negligible interest in video, and I’m trying to convert your findings for stills photography. You’ve reassured me that the optical low pass filter is likely to be reducing the resolution of my Nikon D800 less than I feared it might. What I think would most useful for me is to better understand which are the key MTF curves for lenses for my D800 (“full frame”, 36MPx), or any future camera I might buy. But I’m confused as to the precise scale of the video sensors you’ve modelled.
Your chart refers to a Super 35 sensor size, with an 8K video version having 36MPx and 2.9µm pixel size. When I looked up 8K video resolution, I found 7680Px × 4320Px (33.18 MPx). With 2.9µm pixel pitch, that would give a
sensor of 22.3mm × 12.5mm, which is smaller than the size I found for a Super 35 sensor.
Should I assume the key parameter is pixel pitch, and that the 8K modelling was done on a pixel pitch of 2.9µm, etc? I understand that the pixel pitch of my D800 is 4.88µm, which would sit half-way between the 5.8µm and 3.8µm pixel pitches you quote for 4K and 6K video, and is more or less 60% of the spatial frequency of a 2.9µm pixel pitch sensor.
With thanks in advance,
Chris
Brandon Dube ·
7680p is, well, 7680p. Much like how 4K UHD is usually 3960p. The “real” 4K is 4K DCI – Digital Cinema Intermediate, which is 4096px – 23.75 x whatever mm. I used 8K DCI, which is 8192px wide.
The D800, with a 4.9um pixel pitch, has a nyquist frequency of about 100lp/mm, which puts it smack dab in the middle of the 4K and 6K curves.
FWIW, the formula for nyquist is 1/2*sample_spacing, pixel pitch == sample spacing. 1/2*0.0049 ~= 100.
I don’t know how strong the D800 AA filter is — the one I modeled was just an example, but it would be just as easy to model any other AA filter strength.
Evan Burns ·
If you were shooting with a 2x anamorphic, and unsqueezing in post, would that just lower the resolution of the camera in these graphs? I was always under the impression that more resolution = better for anamorphic.
Brandon Dube ·
It depends on the setup.
If you use a 4:3 sensor with an anamorphic (e.g. alexa) and desqueeze in post, the resolution (MTF) in the neutral axis would remain the same, and the resolution (MTF) in the squeezed axis would drop by 2x.
Anamorphics often have extreme astigmatism at the edges of the image, making it blurry. This is sometimes by-design, like one or two of Panavision’s anamorphic linenups, otherwise like the master anamorphics, the design is very good over the full FoV.
KWNJr ·
Would a pinhole lens be a perfect lens?
Brandon Dube ·
It is a type of perfect lens – it cannot have any aberrations.
But the f/# is usually like f/60 or even slower than f/100, so there is a whole lot of diffraction to deal with.
Federico Ferreres ·
Very good article. Thanks!! Very informative and didactical, in addition to very relevant.
Dimy ·
The best matching lens/sensor system we ever analyzed was the 5 element 8MP from the Iphony 5S. In nearly every other consumer system the lenses cannot keep up with the sensor resolution (besides an old 2MP Casio I own)!
Andrii ·
The very best article on the system (lens + sensor) MTF I have ever read. Thanks!