Just MTF Charts: Rokinon / Samyang Lenses
I’m going to add some qualifications to the Rokinon / Samyang MTF post. First, the results are a mixture of both brands (which are identical except for the label). Lensrentals stocks mostly Rokinon labeled because of better (the bar is low here) service in the U.S., so the website calls them Rokinon. Our software calls them Samyang because Samyang Optics actually manufactures all of them. So you’ll see a graph labeled Samyang with links to a lens labeled Rokinon.
Second, this post includes both the photo lenses and the Xeen Cinema lenses. We’ll be putting out the MTF charts for other Cinema lenses following the photo series. While many cinema lenses are rehoused photo lenses, the rehousing itself might make some differences in variation, or even slight differences in optical performance. Because we only have results for a few Rokinon lenses we’re going to put their Photo and Cinema lenses in the same post.
Finally, I’m going to address 32 inevitable comments that are coming, basically stating “I have one of those, and it’s way better than what you say”. Good for you, my friend; I’m not surprised. Remember these are average MTFs of multiple copies done in multiple rotations. Half of you that own the lens should have one that’s better than the graph, half of you worse.
That’s true for any lens, but Rokinon’s have more variation than most lenses, so the difference is more noticeable. I have carefully kept variation graphs out of this series of posts because ‘just MTF’. But in this case, it’s worth mentioning. In the comparison below the area of the graph shows the range that 96% of copies will fall in. It should be pretty obvious that more variation means a bigger difference between a good copy and a not so good copy.
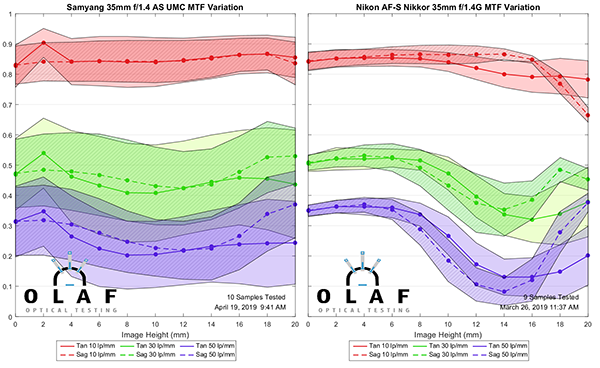
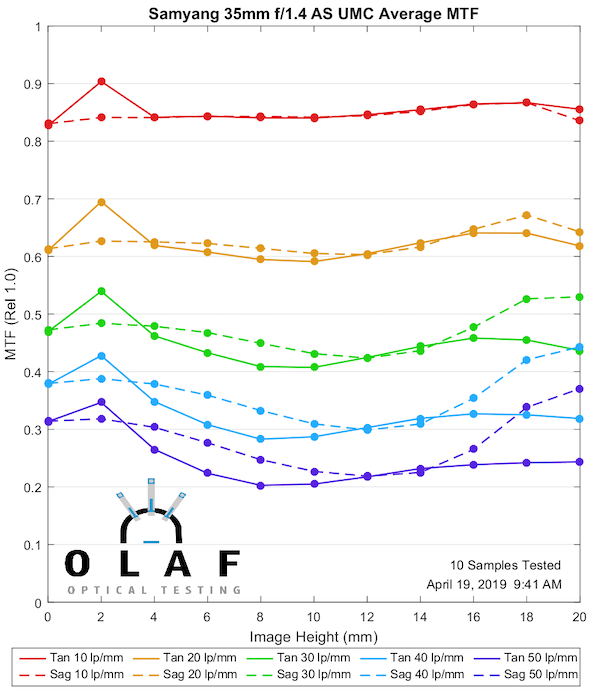
Put into words, the Samyang and Nikon lenses have about the same average MTF. But if I mixed up 10 copies each of the Samyang and Nikon 35mm f1.4 lenses, I can guarantee you that the best copies of the group would be Samyang. Also, the worst copies would be Samyang. So I fully expect some ‘my Samyang is way better than you say’ and ‘my Samyang is way worse than you say. That’s how statistics work.
Because I sometimes get quoted out of context, let me be really clear about what I mean. I’m not trashing Samyang/Rokinon lenses; I like them and I own a couple personally. They offer remarkable value for what they deliver. But there’s no magic; you don’t get the same build quality, quality control, or optical adjustments that you do in a lens costing 5 times as much.
Finally, just in case someone asks, the ‘Cine DS’ line is identical to the photo lens other than geared rings. We’ve tested them and they are optically identical, just to confirm that. The Xeens are mechanically different and therefore it’s possible that performance could be slightly different, so I show them separately.
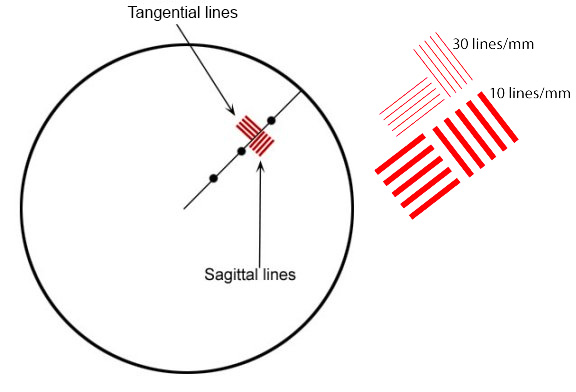
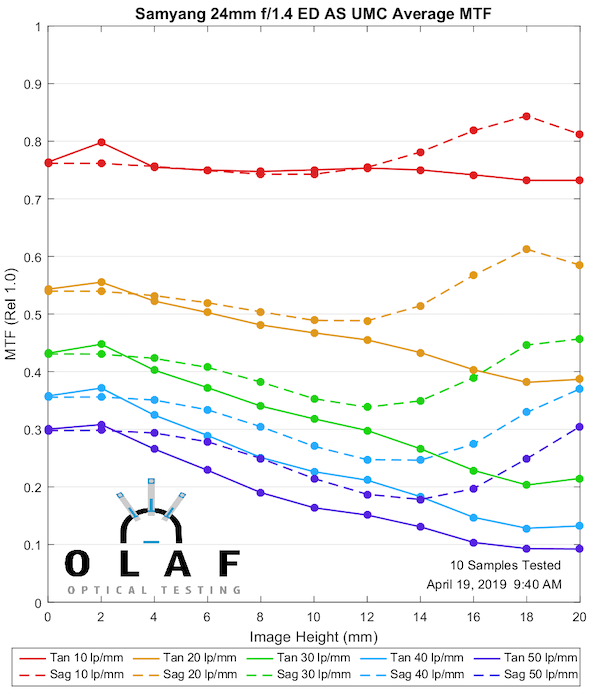
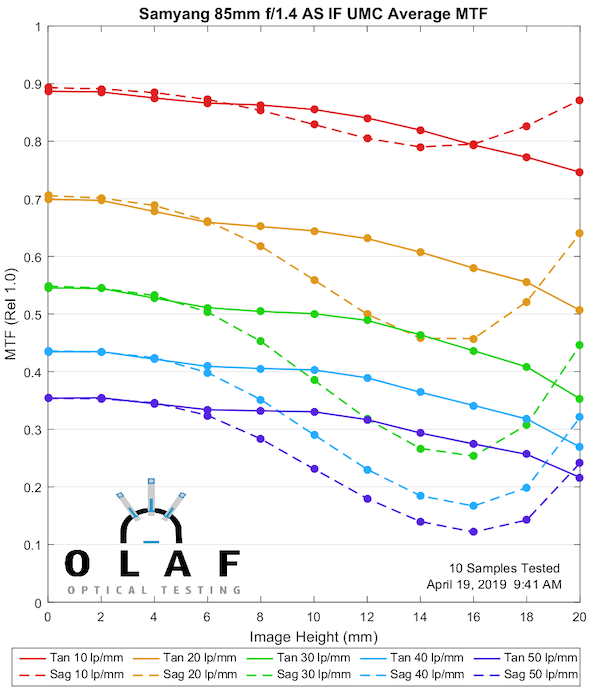
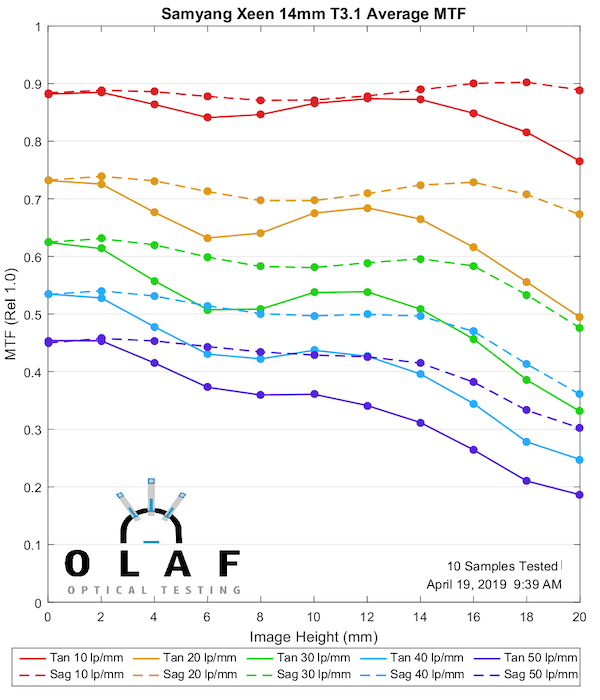
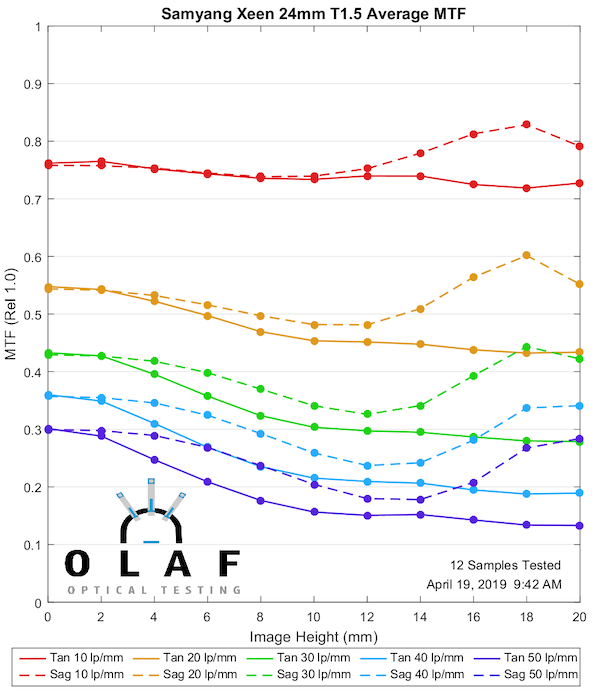
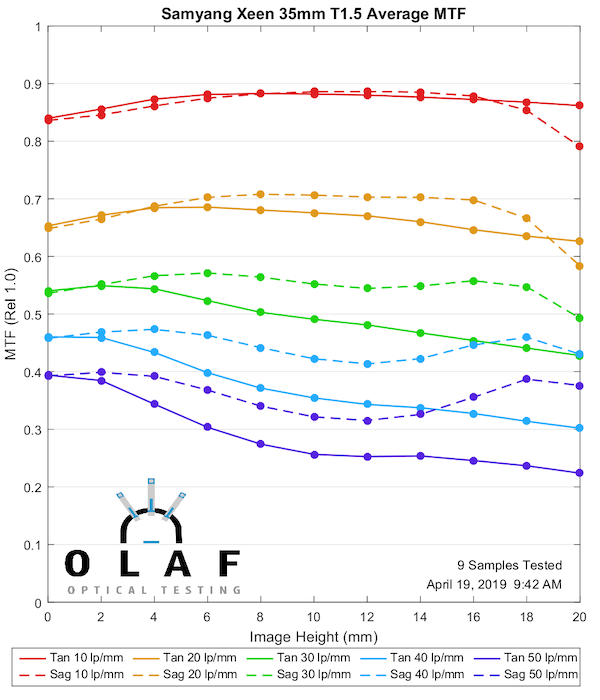
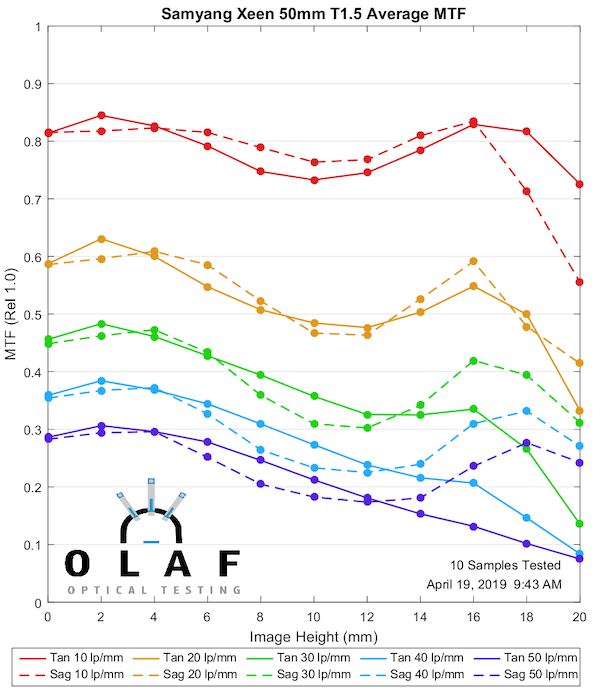
A Quick How to on Reading MTF ChartsIf you’re new here, you’ll see we have a scientific methodology to our approach, and use MTF charts to measure lens resolution and sharpness. All of our MTF charts test ten of the same lenses, and then we average out the results. MTF (or (or Modulation Transfer Function) Charts measure the optical potential of a lens by plotting the contrast and resolution of the lens from the center to the outer corners of the frame. An MTF chart has two axis, the y-axis (vertical) and the x-axis (horizontal). The y-axis (vertical) measures how accurately the lens reproduces the object (sharpness), where 1.0 would be the theoretical “perfect lens”. The x-axis (horizontal) measures the distance from the center of a lens to the edges (measured in millimeters where 0mm represents the center, and 20mm represents the corner point). Generally, a lens has the greatest theoretical sharpness in the center, with the sharpness being reduced in the corners. Tangential & Sagittal LinesThe graph then plots two sets of five different ranges. These sets are broken down into Tangential lines (solid lines on our graphs) and Sagittal (dotted lines on our graphs). Sagittal lines are a pattern where the lines are oriented parallel to a line through the center of the image. Tangential (or Meridonial) lines are tested where the lines are aligned perpendicular to a line through the center of the image.
From there, the Sagittal and Tangential tests are done in 5 sets, started at 10 lines per millimeter (lp/mm), all the way up to 50 lines per millimeter (lp/mm). To put this in layman’s terms, the higher lp/mm measure how well the lens resolves fine detail. So, higher MTF is better than lower, and less separation of the sagittal and tangential lines are better than a lot of separation. Please keep in mind this is a simple introduction to MTF charts, for a more scientific explanation, feel free to read this article. |
Rokinon Photo Lenses
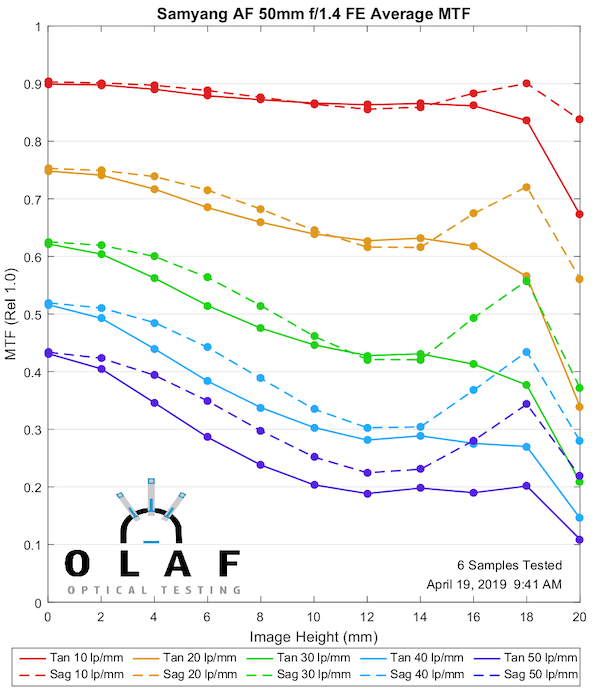
One thing just to stop questions; we don’t have access to most of the “AF” Rokinon lenses for testing, and don’t expect Lensrentals will carry them in significant quantity. They aren’t good rental items. I did add the 50mm f1.4 AF, which is popular in Sony mount, but even then I don’t have the usual 10 copies.
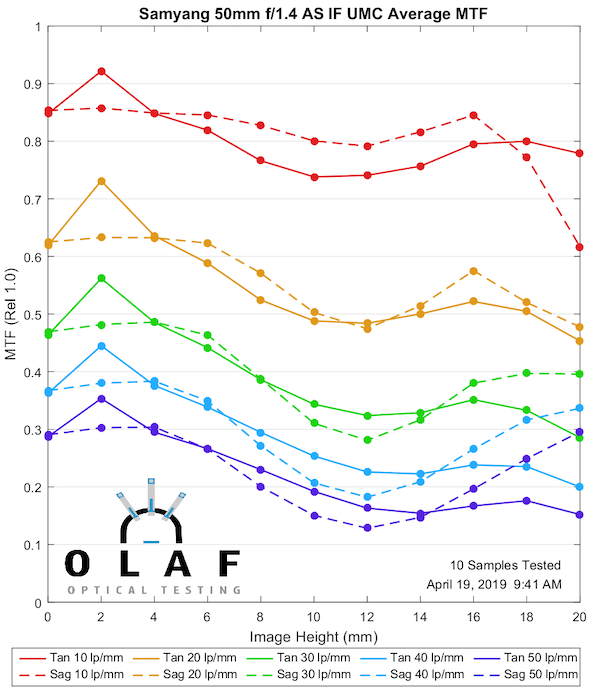
Note: You will notice here, and on the 50mm something we called back in the day ‘the inexpensive hybrid aspheric peak’ at 2mm. These tests were done on early copies and manufacturing of hybrid aspherics has improved since then.
Rokinon 50mm f1.4AS IF
Xeen Cinema Lenses
Roger Cicala, Aaron Closz, and Brandon Dube
Lensrentals.com
April, 2019
35 Comments
Andreas Werle ·
Thanks for the nice MTF-Charts, Roger.
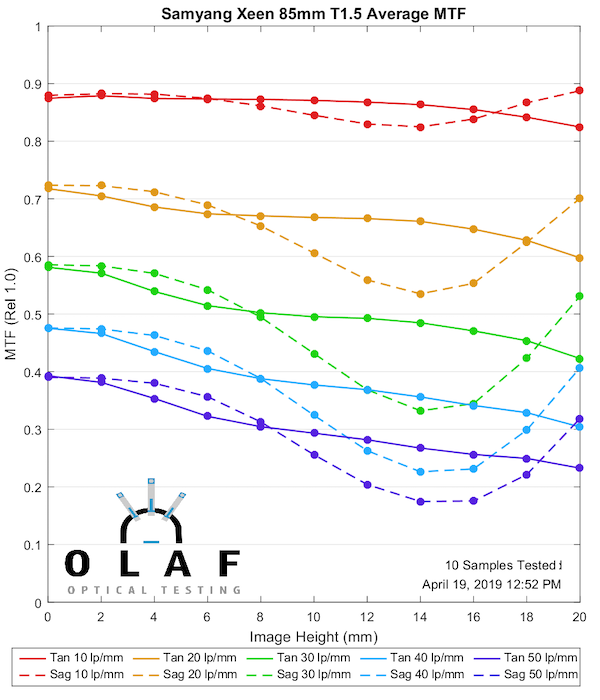
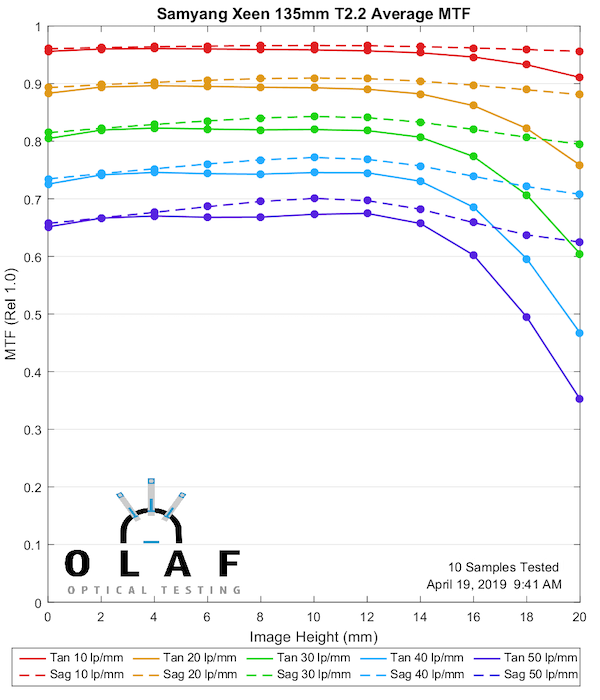
I am a little bit surprised between the difference of the 85mm and 135mm cines lenses. The 135mm seems to be way better, althought both sell for the same price (2300€) . The crucial question is, whether the 135-non Cine (which you do not show) is comparable. It would be a true bargain (500€). Anyway, beautiful work!
Greetings Andy
Roger Cicala ·
Personally, I think the 135mm is the best of the line, I haven’t tested the photo 135mm, but I see nothing to suggest it would be very different than the Xeen and just using it, it certainly seems as good.
Just to get the ‘why haven’t I tested it’ out of the way; the photo versions are not very active renters; at this price it generally makes sense to just buy it. We stock, oddly enough, far more copies of the Xeens than the photos.
Ed Hassell ·
The photo 135 is a favorite of astrophotographers.
bokesan ·
It certainly is. Very similar image quality to the Zeiss APO Sonnar, and even less axial CA. Mechanically the Zeiss is much better though. And you can often get a new Zeiss at bargain, if not quite Samyang-level, prices these days, too (classic, not the optically identical Milvus).
iKonOkLasT ·
Yes. It’s amazing how much the 135 APO is going for nowadays.
iKonOkLasT ·
Exactly comparable; within copy variation of course.
Brandon Dube ·
The two are very different designs.
https://www.flickr.com/phot...
geekyrocketguy ·
Thank you for this analysis. I’m a pretty heavy user of Rokibowyang lenses for astro-landscape work due to their low coma and light weight, but the build quality and quality control is…painful.
Two questions:
1) Do the new, pricey SP lenses (14mm 2.4, 35mm 1.2, 10mm 3.5, etc) have better quality control than the normal Roki lenses? Or does the user still need to play the “order three, keep one” game of Rokinon roulette if he/she wants one with even corners?
2) Has Elite Brands Inc’s customer service improved? About five years ago, they denied a warranty claim by me for repair of a 24mm f/1.4 by claiming that a sticker I put on the lens constituted “modifying” it. I haven’t forgiven them.
Roger Cicala ·
For question 1, I can’t say. We have less stock of these than we used to.
For question 2, it varies. We buy Rokinon because Elite Brands has some warranty service compared to the other names. Mostly it’s a ‘replace-repair’ service where they charge a repair fee but actually send you a new lens. But it’s not consistent. I’m guessing but I think some of that has to do with do they have replacement stock available.
Honestly, I think given their prices, which often are about the price that a repair would cost on a similar name-brand lens, it’s not an unfair deal. We consider them basically to be disposable lenses.
Even though we can do repairs here, the time/labor charge we run up doing it gets close to the price of a replacement lens. It seems like “a $300 repair on a $2,000 lens is reasonable, but a $300 repair on a $400 lens is ridiculous”. Yet, the takes about the same amount of time and labor, so similar cost makes sense – except the lens is so inexpensive new it’s not worth it.
Vladimir Gorbunov ·
Thank you so much! Though it would be very nice if you’d decided to place the variations on all graphs in this series.
Roger Cicala ·
The variation graphs are a blunt tool that requires some discussion with each lens; I’m trying to keep this straightforward.
Michael Appleman ·
For lenses with a wide variation like that is it just manufacturing tolerances or is it possible to adjust a poor example into a good one if you know what you were doing?
Roger Cicala ·
It depends on the lens optomechanical design. Rokinon lenses, in general, are not adjustable.
MisterWU ·
Why doing a article where readers can’t see a big version of the charts? You block zoom and the photo don’t Pop up.
If you want yours readers run away serving a very bed ergonomic mobile web site is a very good way..
Roger Cicala ·
Zoom isn’t blocked. The charts are 600 pixels wide because they’re easy to read at 600 pixels.
MisterWU ·
Sorry on chrome on android I can’t zoom in your website and the images don’t open on tap, and 600px on last generation screen smartphone is a way to small to be read.
Is just pity because you did a very good job but if people can’t read the results is a bit useless.
Roger Cicala ·
With all respect, I put out 600 pixel wide MTF charts. I did not write Chrome, WordPress, or develop smartphones, nor do I have any knowledge of these things, so I’m no help here.
Ilya Zakharevich ·
Roger, I read what you say as you “borrowing” a certain template for this web page.
What we reported is that this template is intentionally broken: it disables one of the most important features (which cannot happen without intent: 2-finger resizing works by default in Chrome on Android). I suspect that MisterWU knows where the fault is (since he looked through the sources of “your” web page).
Maybe if we ask him nicely, he can advice how to fix this?
And guys: I’m completely appalled by your reaction to a guy who has a legitimate complaint about the organization of this sight. MisterWU, if I were eligible, I would gladly summarily apologize for the replies you got here…
Roger Cicala ·
Ilya, what I meant was “I have no clue”. I don’t run the blog, I just write lots of articles. I honestly don’t even know what it is running on other than it’s some ancient version of WordPress, and I have absolutely no knowledge about how to change or modify anything other than adding articles.
I did forward the issue to the people who manage the blog. Doing that is like their #63 priority, the blog generates no revenue and not much traffic, so it took a few days for them to respond. I’m told this is the default of the version the blog runs on, there was a plug in that corrects it, and they’ve installed it now. It seems to work they say.
Ilya Zakharevich ·
> Zoom isn’t blocked.
??? 2-finger zooming does not work on this page in Chrome on my Android device.
> The charts are 600 pixels wide because they’re easy to read at 600 pixels.
Roger, this does not make any sense (given the absence of zooming!). It could make some sense if you’ve said “at 600 points”?—?but even then it would depend on which of my eyeglasses I’m currently using.
Leo ·
Go do your own testing then, ingrate.
MisterWU ·
Did you read what I write or you are just impolite??
Leo ·
Did you read what yourself wrote or are you just impolite? You straight up accuse the author, as if these faults are intentional while it could very well be a bug in the rendering engine or the framework this blog uses. I don’t think Mr. Cicala intends to have “readers run away [by] serving a very [bad] ergonomic mobile web site”, nor did he want his readers to be unable to see a bigger version of the charts.
600px long-edge is plenty big if your phone supports normal scaling behavior. If your high-ppi/dpi device can’t support correct scaling, it’s the render engine’s fault.
It’s a bit funny when the rude accuses others of being impolite.
MisterWU ·
I don’t know if you are more ridiculous or funny, you try to sound like an expert but you just write down a bunch of BS.
I don’t have any problem with my phone on any web site that are developed following the actual standard’s.
If a web site have a bed ergonomics I know what I am talking about since I work on media market since 22 years and I pay each month few web developers who works on my agency.
Normally my advice is quite expensive, I know exactly what is the problem with the site because I inspect the code before write anything.
I love this blog is just frustrating when you can’t reach the information swiftly and I don’t have any problem with the owner.
If you find my comment rude is probably because you grow up on very soft environment but you don’t have any problem to be aggressive whitout any reason.
Try better next time but, suggestion, don’t try arguing with an expert.
Leo ·
You advice is quite expensive while you can’t even spell “bad”. Amazing.
bdbender4 ·
Troll
Max da Meme ·
You can spend time inspecting the code of the website but can’t inspect your own grammar before you press post? As far as the website goes, all of my devices that I own can render the website perfectly and allow me to look at the graphs so I think its a you problem. It’s also easy to argue when you refuse to address any of the other person’s points and dismiss them as “a bunch of BS”. I guess that’s how you become an expert at it. -Max Dinniene
Piotr Slopnicki ·
How much did you pay for a pleasure of viewing these charts?
MisterWU ·
Was faster to order the lenses and try out myself.
Graham Stretch ·
My guess is it is a Wu problem!
I’m no expert and I don’t profess to be anything other than a casual observer.
The charts render almost full height and approximately half the width of my iPad Pro (11 inch) screen in landscape orientation and if this isn’t large enough I can zoom to full screen width with the usual (2 finger salute) motion.
On my iPhone the charts are full screen width in landscape orientation and I can zoom until the LA of the Olaf text is all that is visible on the screen plus a bit of the logo above the LA (still in landscape orientation).
On my windows laptop I can zoom until the charts almost fill the screen width, so I’d guess (and it is just that, a guess) that it is a device / settings issue and not a page issue.
Though no doubt I’m full of BS and you are still correct despite me having tested it on 3 different devices!
Regards, Graham.
lwestfall ·
Thank you so much for the wonderful MTF resource you’ve created! It would be great to see you test the new Samyang 85mm f/1.4 AF FE lens for Sony that has been making waves for apparently besting the Sony GM and matching the Sigma at half the price and size and weight. It might just become my second Samyang lens ever, joining my 135mm T2.2 AS UMC lens which has always impressed me.
Chen ·
Thank you Roger. I second the request to test the new Samyang 85mm f/1.4 AF FE
WindowsiPhone ·
I was hoping to see the Samyang 35mm F2.8. Darn!
Astro Landscapes ·
Has OLAF had his way with the Roki-Yang 14 2.4 SP/XP yet? I want to see how it looks versus the Sigma 14 Art…
iKonOkLasT ·
Thanks for the correction. I really confused up the Samyang with the Zeiss.