Equipment
Testing Lenses: Best Individual Focus MTF Curves
OK, in the last post we did something useful, but rather boring: we looked at how MTF changes when lenses are stopped down. Today we’re going to use a more powerful optical bench tool, the MTF vs. Field vs. Focus. Unless you work in a metrology lab (and probably not even then, very few are performing this test) you aren’t familiar with what this is, so I’m going to take a minute to show you.
Standard MTF
When we (or anyone else) does a standard MTF it works like this:
- The machine very accurately focuses on the center point of the lens.
- It then measures the MTF from the center to one edge at that best center focus.
When that is done, you get the MTF graph you are used to seeing.
Olaf Optical Testing, 2017
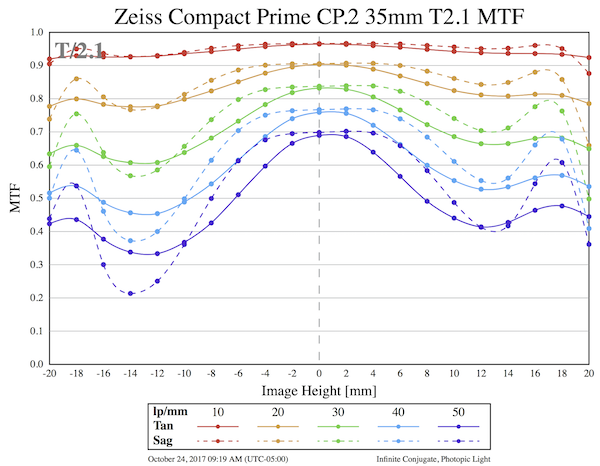
The standard MTF says “if you focus at the center of the lens, the graph shows you how sharp the image will be from one edge to the other.” The graph above shows the image for the standard MTF for the Zeiss CP.2 35mm T2.1 and shows us it stays pretty sharp from one edge to the other. A lot of lenses don’t stay sharp from one side to the other, though.
MTF vs. Field vs. Focus
We can do things a different way, though, and measure the MTF vs Field vs Focus. We program the MTF bench to do this:
- The machine very accurately focuses on the center point of the lens.
- The machine then backs the focus away 300 microns from that focus.
- The machine then measures the MTF, moves forward a few microns, and measures it again. Basically, at every point it measures the MTF 20 times, changing focus a bit each time.
- The machine repeats this step at 40 points from one side of the lens to the other.
So what we end up with is a huge bunch of data. At each of 21 points across the lens, there are 800 measurements saved compared to 20 measurements per point (sagittal and tangential, each at five frequencies) on a standard MTF. That’s a lot of data; a bit over 16,800 data points per tested lens.
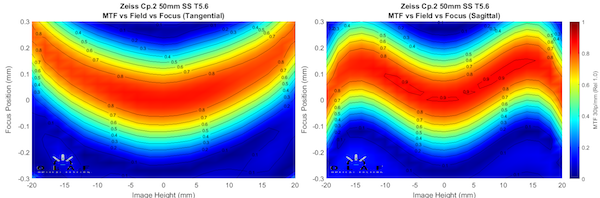
We usually graph it something like this.
Olaf Optical Testing, 2017
That’s good information. It shows you how the field of focus curves if you’re focused on the center point. For the lens above, it also shows you that away from the center, the image will be sharpest at a different focusing distance than it is at the center. The “0” in the middle of the Y axis is the best center focus, the top and bottom of the charts are +/- 0.3mm of focusing distance.
In other words, if you focus at the center, your image will be sharper closer or further away as you look from one side to the other; what we call field curvature.
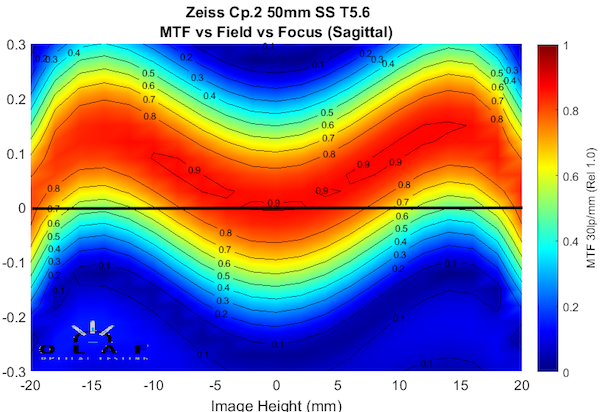
But back to MTF. Let’s take a close up of the sagittal field on the right. I’m also going to draw a black line across the graph to show the focusing distance chosen as “best focus distance for the center of the image.” That black line shows you where the focus was for the standard MTF, and the MTF values along that line are what the standard MTF showed.
Olaf Optical Testing, 2017
The graph below is that standard MTF, and it shows the lens is quite soft 12 to 16mm away from the center (the outer 1/3 of the image). But if you look at the field curvature above, you know that softness is because the best center focus isn’t the best focus for most other points across the field. The lens could be a lot sharper from 10m to 16mm if we had focused there, instead of at the center.
Olaf Optical Testing, 2017
Why is this practical? When I make an image with the subject in the outer 1/3 of the image, well, I’ll focus in the outer 1/3 of the image. When a lens has strong field curvature, as this one does, the standard MTF curve doesn’t tell me a thing about how sharp the image might be if I focus there instead of the center.
We’ve been busy writing programs that let us get more information from the MTF v Field v Focus test. The one I’m going to show you today is ‘individually focused MTF,’ which will answer the question ‘how sharp is it when I focus there?’ In other words, if I focused the lens at the point 10mm off center instead of at the center, how good would the MTF at 10mm be?
Best Individual Focus MTF (BIF-MTF)
We could search through those 16,000 data points in the MTF v Field v Focus graph from center to edge, plotting ‘what is the best possible MTF at each individual point if we focused there.’ If I plot this ‘best individual focus MTF,’ it looks entirely different than the standard MTF above.
Olaf Optical Testing, 2017
To make it simpler, I’ll put thumbnails side by side: standard MTF on the left, ‘best individual focus MTF’ on the right. (Please ignore the different layout of the graphs, I’m working with two different versions of our software.)
Olaf Optical Testing, 2017
They look like two different lenses, don’t they? In reality, depending on how you use them, they are. If you focus at the center point, you get the standard MTF graph on the left. The standard MTF suggests that the lens is really sharp for about 5mm to either side of center (the middle 1/4 of the image) then falls off.
If you focus at a specific point away from center, though, the ‘best individual focus MTF’ graph shows you can get a sharp subject all the way out to nearly 16mm from center, which is all but the very edge of the image.
Remember, though; the graph isn’t reality. If you did focus at, say 16mm away from the center, the rest of the image wouldn’t be as sharp as the graph says. The center would be quite soft if you focused at the point 16mm away from the center, just like the 16mm point is soft when you focused at the center.
The best individual focus MTF graph tells you is how sharp the image could be at each single point; it says nothing about how the rest of the lens would look if you focused there. To demonstrate, here’s what the Zeiss 50mm T1.5 MTF looks like if I set the focus to be best at 14mm away from the center.
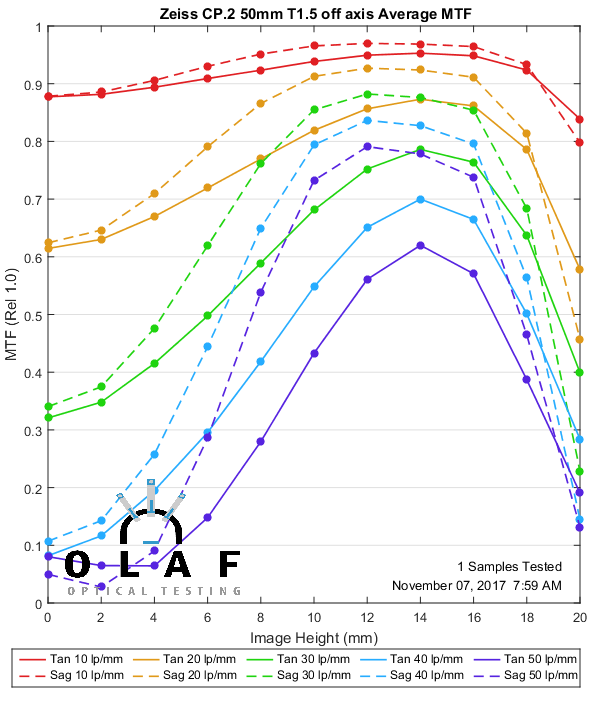
Olaf Optical Testing, 2017
Still, this is good information to have. If you’re framing a scene with an off-center subject, knowing how far from center you can get a sharp image is useful. And it’s different for each lens; there’s no general rule for how far away from center you can stay sharp. This is an extreme example; most lenses don’t change this much if we compare standard MTF and best individual focus MTF. But most lenses do change to some degree.
As an aside, this is a nice illustration showing that when people argue about whether the Zeiss 50mm Super Speed (as an example) is soft or sharp away from center, well, they’re both right. It depends on how they’re using the lens. A landscape or architectural photographer focusing in the center would say the lens is very soft in the outer half. A portrait photographer would counter that the eyelashes of his subject are very sharp even though they are posed in the outer 1/3 of the image.
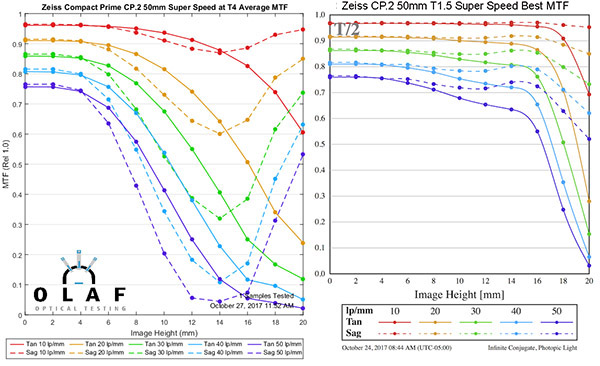
I’m going to put up the best focus MTF charts for all of the Cinema primes we tested in the last article. On the left is the MTF taken at T4 in the standard way, on the right the ‘best individual focus MTF’. The graphs are slightly different sizes because the best focus MTFs are from a beta version of our new software.
If enough people think this is something they will find useful, we’ll start publishing them for all of the lenses we test.
85mm Lenses
All of the 85mm lenses show some improvement at best focus and perform well far away from the center. And then there’s the Sigma 85mm. I don’t have the words, other than I been telling you all that lens is amazing.
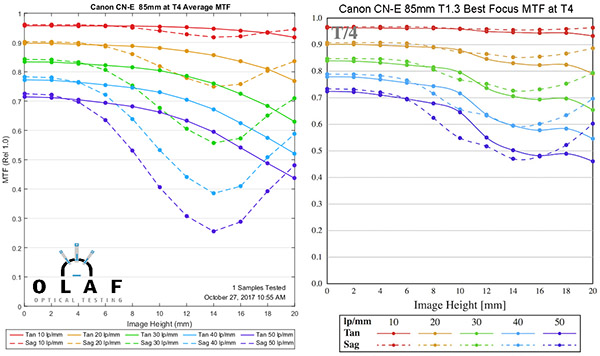
Canon CN-E 85mm T1.3
The Canon 85 can get ‘near center’ sharp out nearly half-way to the edge. Further than that there is some loss of fine detail (higher frequency lines) but it’s not severe at T4. I really wouldn’t hesitate to use this lens all the way to the edge of the field.
Olaf Optical Testing, 2017
Sigma Cine 85mm T1.5
I am unworthy. There is moderately mind-boggling goodness all the way to the edge.

Olaf Optical Testing, 2017
Rokinon Xeen 85mm T1.5
The Xeen 85mm really didn’t drop its MTF until halfway to the edge when we used center focus. There is some improvement in the outer 1/2 with best individual focus, but performance does fall off a bit beginning 2/3 of the way to the edge.

Olaf Optical Testing, 2017
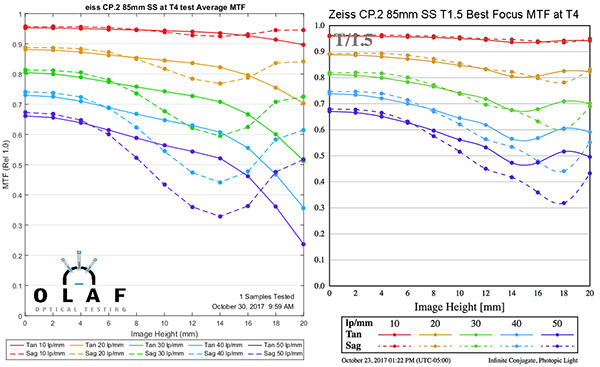
Zeiss CP.2 85mm Super Speed T1.5
The Zeiss Super Speed does improve to some degree with best individual focus, and there’s no sudden drop off.
Olaf Optical Testing, 2017
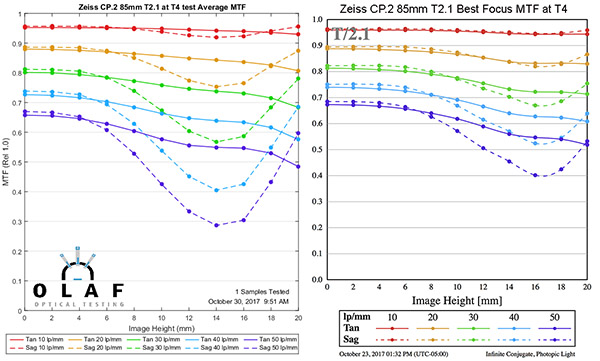
Zeiss CP.2 85mm T2.1
The two Zeiss 85mm, if I remember correctly, are identical optically and differ only in the mechanical size of the aperture. It’s not surprising that they behave similarly at T4.
Olaf Optical Testing, 2017
50mm Lenses
As the field gets wider, we expect to see more weakness near the edge of the field, even with best possible focus, since there are often more aberrations.
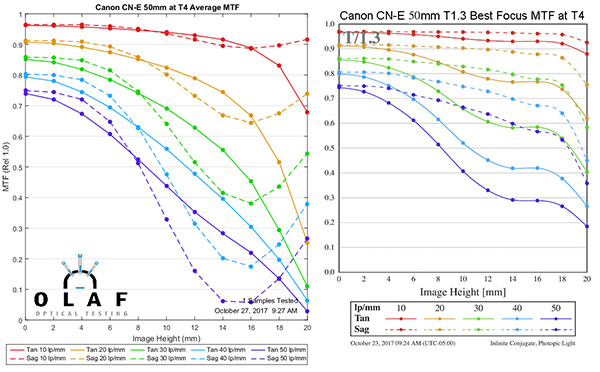
Canon CN-E 50mm T1.3
Well, it is a very old design and the only T1.3 lens at 50mm. It struggles a bit away from the center at higher frequencies (fine detail) no matter where you focus. But it is better off axis than the standard MTF curve leads us to expect.
Olaf Optical Testing, 2017
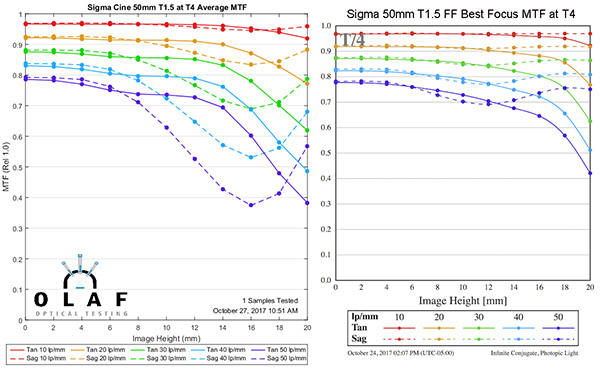
Sigma Cine 50mm T1.5
OK, it’s not quite as spectacular as the Sigma 85mm, but it’s absolutely excellent to 2/3 of the way to the edge and pretty good even further away.
Olaf Optical Testing, 2017
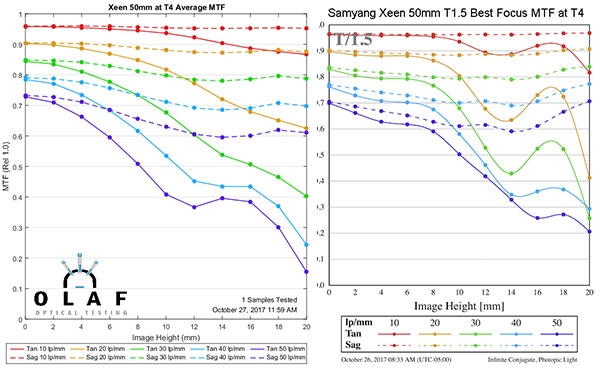
Rokinon Xeen 50mm T1.5
Like the 85mm, the Xeen 50mm doesn’t have a lot of field curvature, but there is some. It stays quite sharp till just under the halfway-to-the-edge point, but you lose sharpness and keep astigmatism in the outer half of images, even at best focus. It’s performs pretty well stopped down but doesn’t improve quite as much as the others at best focus away from center.
Olaf Optical Testing, 2017
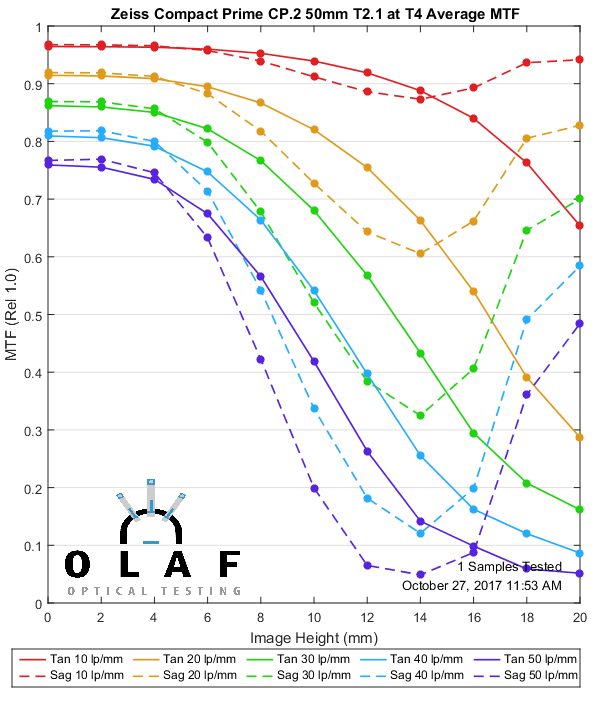
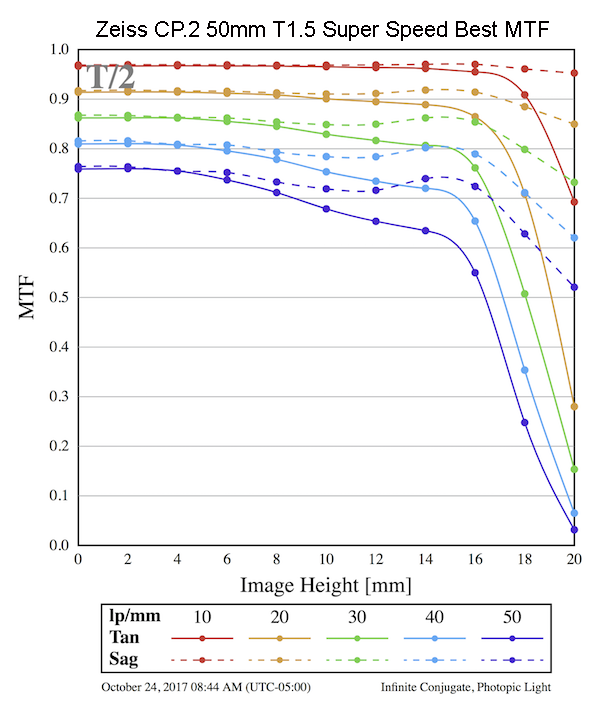
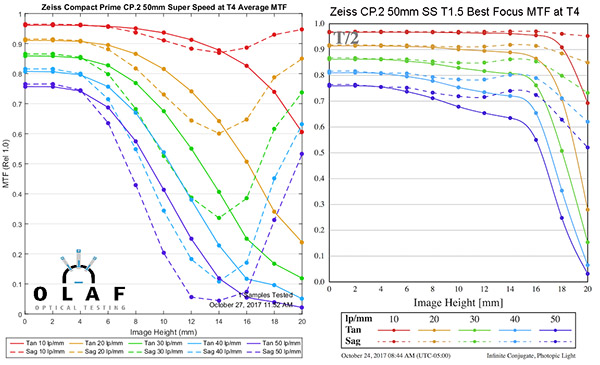
Zeiss CP.2 50mm Super Speed T1.5
This was the lens we used in the introduction because the difference is so amazing. It’s exceedingly sharp out to 3/4 of the way to the edge if you’re focusing out there. It’s really close to the Sigma in quality until you get very near the edge.
Olaf Optical Testing, 2017
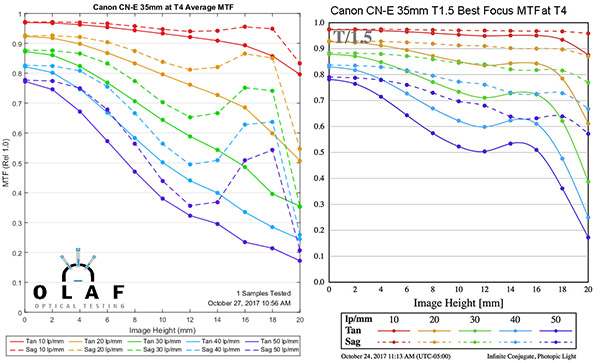
35mm Lenses
We generally think of wider-angle lenses as having more field curvature, so we’d expect they should look entirely different with best individual focus. They do, but a bit less so than I expected. Probably aberrations are causing more issues than field curvature away from the center at this focal length.
Again, things look a better away from the center than the standard MTF seems to indicate. It’s not quite as sharp as the longer focal length lenses, but then, it’s not the longer focal length lenses.
Olaf Optical Testing, 2017
Sigma Cine 35mm T1.5
Like I said for the Canon, although perhaps a little better. Remember, the Sigma Cine lenses are much newer designs than the others we’re testing here.
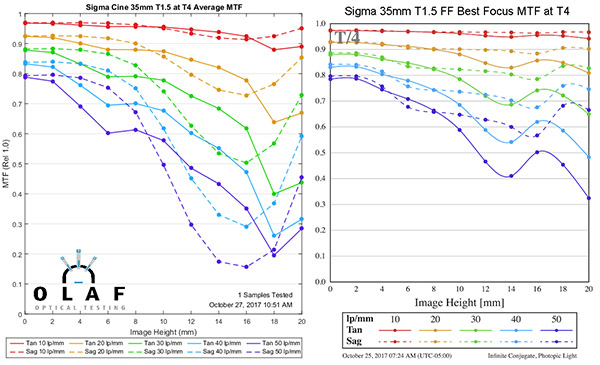
Olaf Optical Testing, 2017
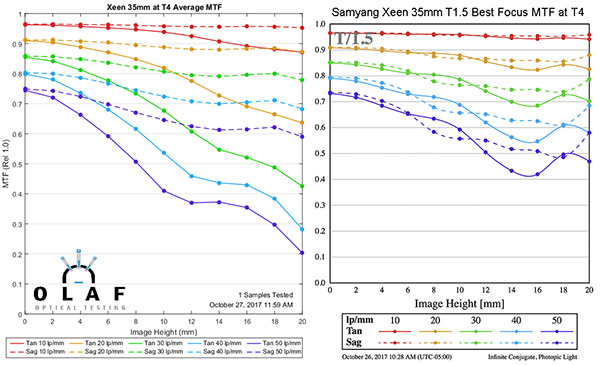
Rokinon Xeen 35mm T1.5
The Rokinons seemed to improve the least at the longer focal lengths, but may improve the most here at 35mm. That’s a dramatic difference.
Olaf Optical Testing, 2017
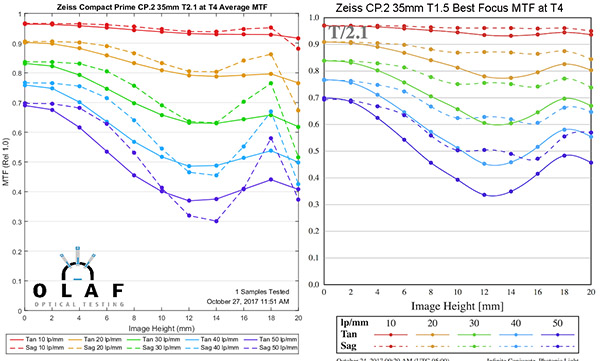
Zeiss CP.2 35mm T2.1
While we do get some improvement with the Zeiss 35 T2.1, it’s not dramatic.
Olaf Optical Testing, 2017
Wider Lenses
I was less certain what to expect with the wider lenses; they do have field curvature, but also tend to have more aberrations away from center that don’t improve with specific focus.
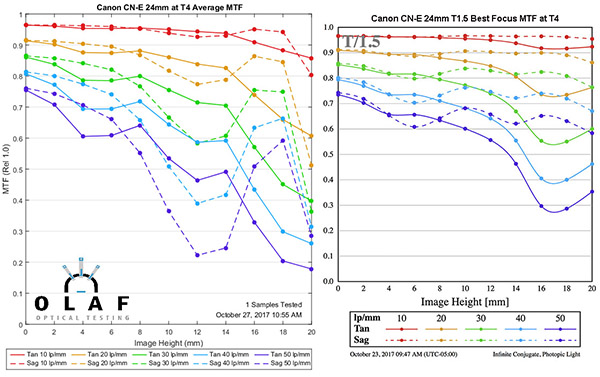
Canon CN-E 24mm T1.5
The Canon 24mm shows it’s capable of better performance off-axis than the standard MTF curve suggests. It has near-center sharpness to 8mm away from center, and decent performance to about 12mm before falling off.
Olaf Optical Testing, 2014
Sigma Cine 24mm FF T1.5
The Sigma 24mm standard MTF curve looks a bit like the Zeiss 50mm SS, and I was hoping for dramatic improvement at best focus. It does improve, no question, but in the outer 1/3 there is still significant fall off. It does perform better in the middle 1/3 of the image than the standard MTF curve suggests.
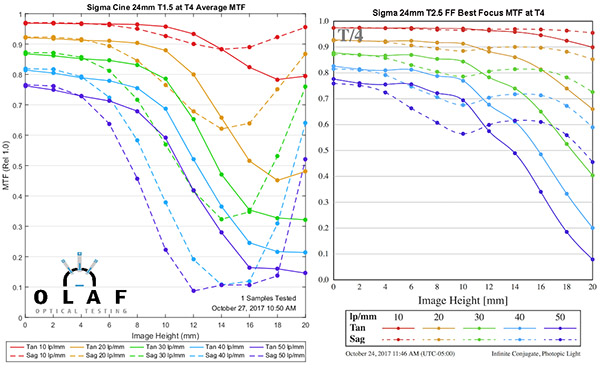
Olaf Optical Testing, 2014
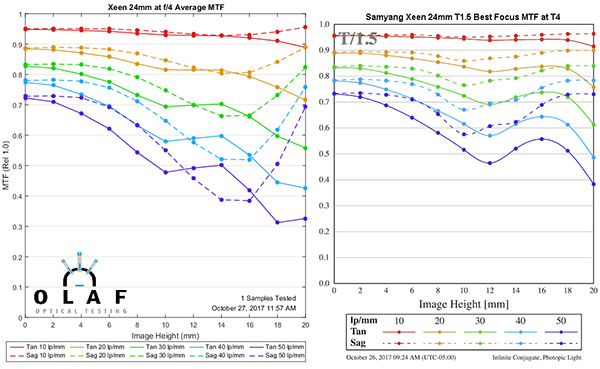
Rokinon Xeen 24mm T1.5
Similar to the 35mm, the Rokinon 24mm’s best individual focus stays good a bit further out than most 24mm lenses.
Olaf Optical Testing, 2017
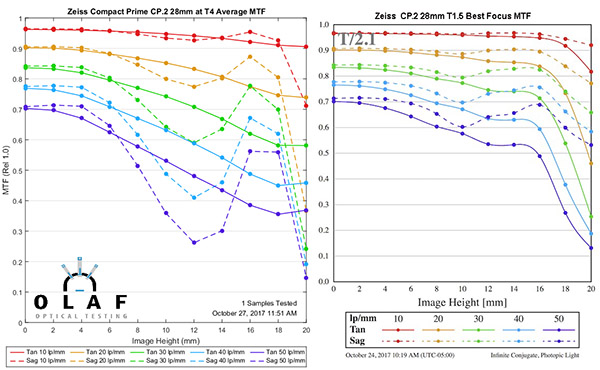
Zeiss CP.2 28mm T2.1
The Zeiss 28mm is another lens that shows decent performance 3/4 of the way to the edge with best individual focus MTF, much better than the standard MTF suggests.
Olaf Optical Testing, 2017
Zeiss CP.2 21mm T2.9
The legendary 21mm Zeiss does improve a little bit with best individual point focus. The ‘most sharp’ area ends about 6mm away from center with both standard and best focus MTF, though.

Olaf Optical Testing, 2017
So What Should We Do About This?
With the last post, it was obvious that we should add MTF tests at apertures other than wide open. The Best Individual Focus MTF (BIF-MTF) is a different thing. For one, it’s strange. You’ve never seen it before because no one’s ever done it before.
For the major piece of data it presents, ‘How far from the center can you focus and get near-center sharpness at that point’, I could give as a number without showing the graph. For example, it would be 6mm (about 1/3 the way to the edge) for the Zeiss 21mm above; or 15mm (3/4 the way to the edge) for the Zeiss CP.2 50mm Super Speed. The graphs, though, do present a better picture of whether the drop off is gradual, or sudden. So I’m open to discussion as to whether the graphs are worth showing in our reports.
To some degree, you can get that information from the Field Curvature graphs, which we are going to show with all lenses going forward, but the field curvature compresses the data a lot. You can’t tell if a red area in the Field Curvature graph is .80 or .89 and that can be a big difference.
There’s another neat trick we can do with the MTF v Field v Focus data that may be more useful for some types of images, but this post is already plenty long so we’ll save that for Part III.
Addendum: As Ilya pointed out in the comments, the beta software BIF-MTF graphs have a soft gray T number in the upper left corner. Please ignore them, it’s an artifact caused by a combination of not-quite-finished software being used by my very tired brain.
Roger Cicala, Aaron Closz, Brandon Dube, Max Bruggerman, and Markus Rothacker
Lensrentals.com
November, 2017
Author: Roger Cicala
I’m Roger and I am the founder of Lensrentals.com. Hailed as one of the optic nerds here, I enjoy shooting collimated light through 30X microscope objectives in my spare time. When I do take real pictures I like using something different: a Medium format, or Pentax K1, or a Sony RX1R.
-
Roger Cicala
-
Roger Cicala
-
Ilya Zakharevich
-
grubernd
-
DrJon
-
Samuel H
-
Søren Stærke
-
bokesan
-
Guido
-
Brandon Dube
-
Ilya Zakharevich
-
Ilya Zakharevich
-
Brandon Dube
-
Brandon Dube
-
Mike Earussi
-
Ilya Zakharevich
-
Ilya Zakharevich
-
Philip
-
Roger Cicala
-
L G
-
Andre Yew
-
Brandon Dube
-
Mike Aubrey
-
Matt
-
Andre Yew
-
Roger Cicala
-
l_d_allan
-
Roger Cicala
-
Puska
-
Thomas Geist
