Good day! And welcome to our first Cine lens MTF comparison. If you aren’t familiar with what we do here, I suggest you take a glance at our previous post on why we’ve started testing Cine lenses. For those of you who haven’t been here before, let’s be clear about what this is not. It is not a lens review. There are a zillion important things you need to know about cine lenses that we don’t discuss. What we do is optical and variation testing.
Today’s Contestants:
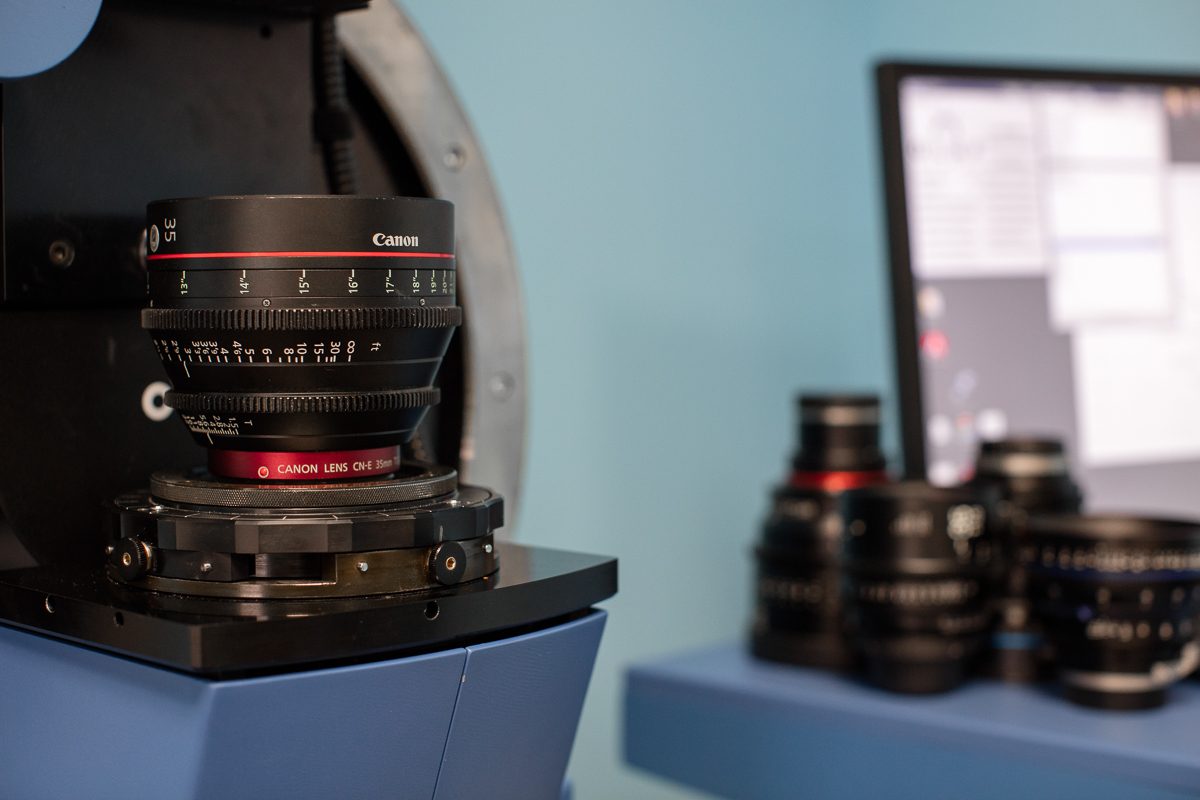
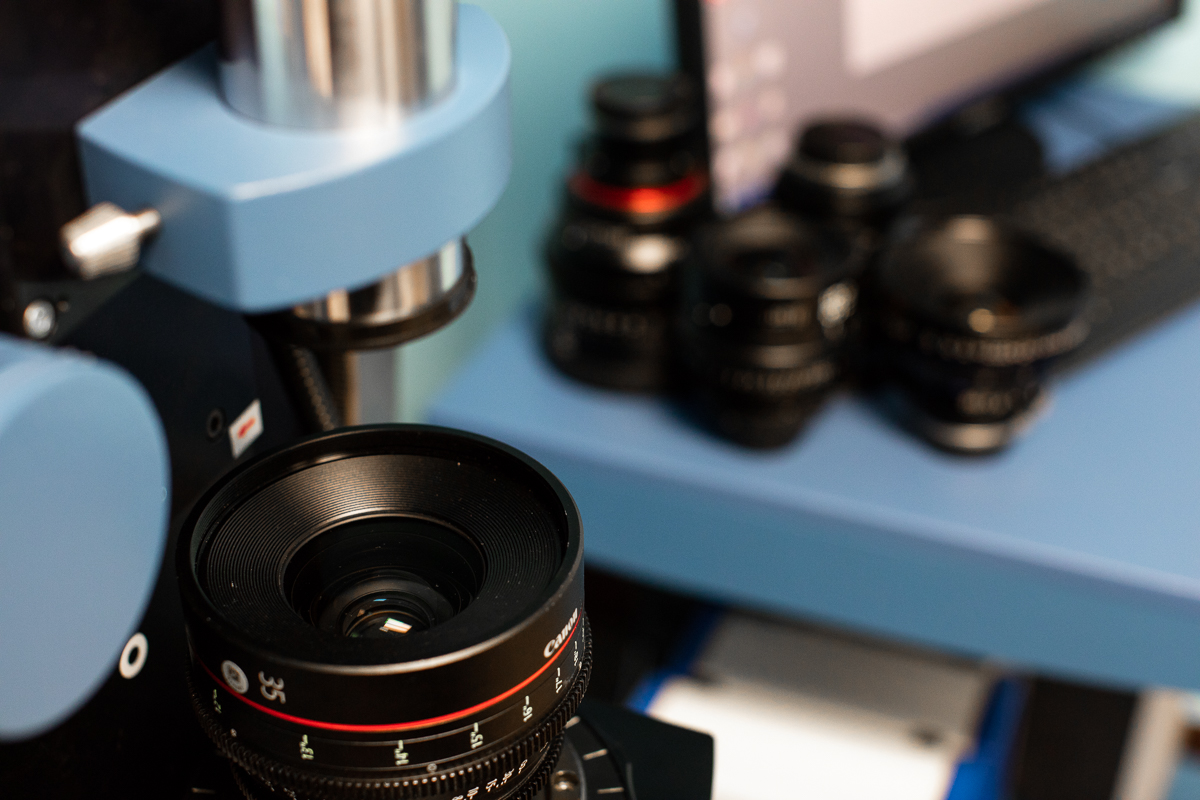
We’re going to look at 35mm focal length, full-frame Cinema primes. We had sufficient copies of five lenses which meet that criteria. I know the price is never an issue for cinematographers, but I’m listing them by price anyway.
| Zeiss CP.2 35mm T2.1 | $3990 |
| Canon CN-E 35mm T1.5 | $3950 |
| Sigma 35mm T1.5 FF | $3499 |
| Rokinon Xeen 35mm T1.5 | $1895 |
| Schneider Xenon 35mm T2.1 | $3360 |
We have three T1.5 aperture lenses and two that are T2.1. It’s important to remember that when looking at the MTF tests because the smaller aperture is a big MTF advantage; we would expect a T2.1 lens to have better resolution than a T1.5 lens. We also have one lens that costs a lot less than the others. It will be interesting to see if you pay the penalty in resolution or variation for that lower price.
Average MTF Curves
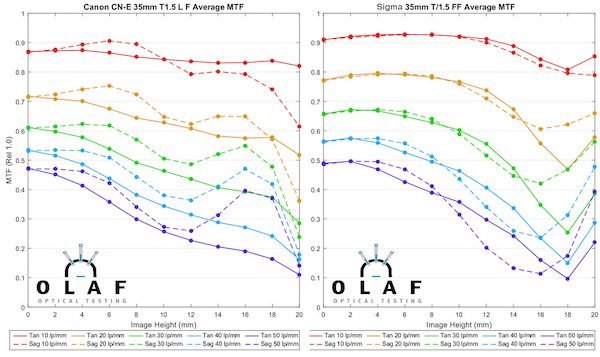
We test multiple copies of each lens, with each tested from edge-to-edge at four rotations, so that get a picture of how each lens behaves in all quadrants. This graph shows what the results look like for a single copy of a lens.
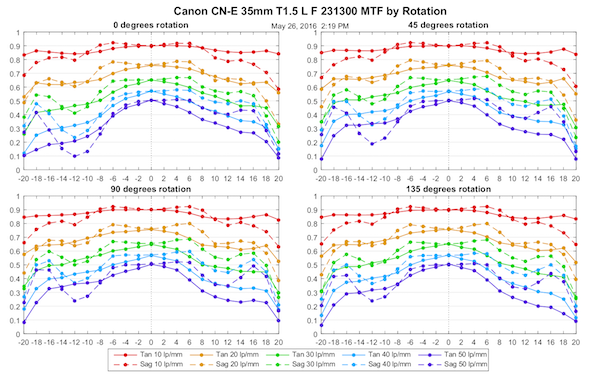
This doesn’t look much like the MTF curves you’re used to seeing from the manufacturer that goes from center to one edge and pretend all lenses will look the same. So we average all that data from 10 copies to give a similar, but real-world, MTF to compare these lenses overall.
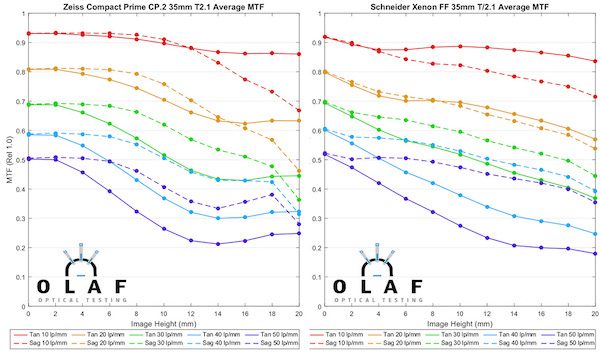
We’ll look at the T 2.1 lenses first; the Zeiss CP.2 35mm T2.1 and Schneider Xenon 35mm T 2.1. Right at the center, their MTF is almost identical. In the middle half of the image, the Zeiss maintains that MTF while the Schneider steadily falls off, but in the outer 1/3 things are pretty even again.
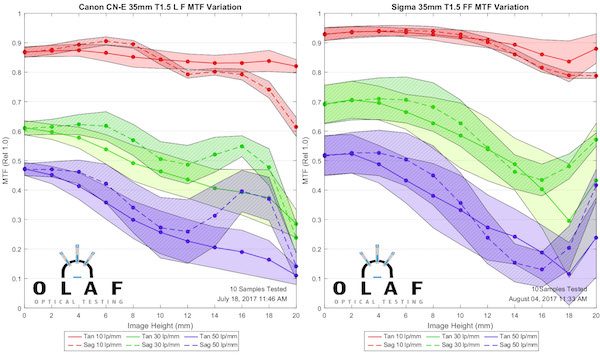
We’ll compare the two more expensive 35mm T1.5 lenses next, the Canon CN-E35mm T1.5 L F and the Sigma Cine35mm FF T1.5. If you’re surprised that the Sigma has higher resolution, remember that it is a very recent lens design. The Canon CN-E is based on the Canon 35mm f/1.4 L photo lens that was released 20 years ago. The Sigma resolves at T 1.5 almost as well as the Zeiss does at T2.1. The recent design does have advantages.
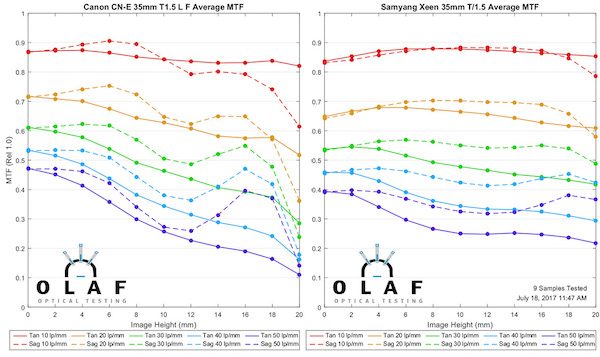
To keep the Rokinon Xeen 35mm T1.5 from being lonely, I’ll repost the Canon results beside it. The Xeen MTF in the center is the lowest of all these lenses, but its resolution stays high across the frame. In the outer 1/3, it’s the best of all.
Fanboys love to declare winners and losers, but what I see five tools with different strengths and weaknesses as far as MTF curves show. Although I will say, the Sigma has a whole damn lot of strengths as far as MTF goes.
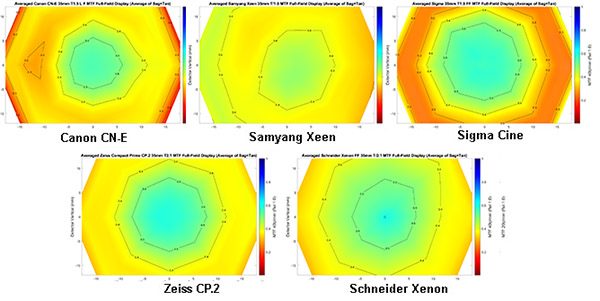
MTF Full-Field Plots
The MTF graphs give a ton of information but aren’t very intuitive. These plots show what the MTF looks like, on average, if we map it as it would be across the field of view of the lens. Each map is of one frequency on the MTF graphs above, with the sagittal and tangential curves averaged together. I’m going to skip over 10 lp/mm; as all these lenses are almost identical there.
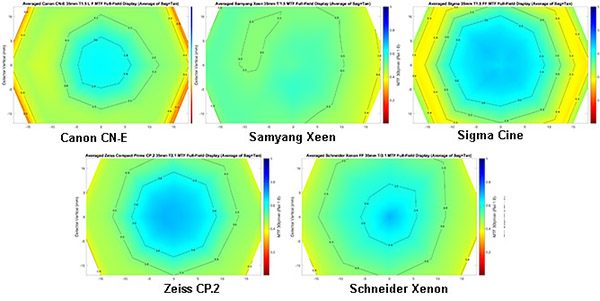
20 lp/mm
I’ve arranged the T1.5 lenses in the top row, T2.1 lenses in the second. Even at this relatively low frequency, you will see some difference in these lenses, with the Sigma and Zeiss a bit better. Again, these are at widest aperture, so the Sigma’s performance at T1.5 is very impressive.
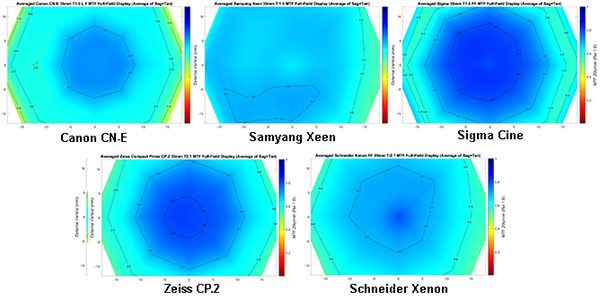
30 lp/mm
This higher frequency is going to be of little importance to anyone shooting 1080p or less, but can be substantial for higher resolution video. How important is going to depend on what you’re shooting and what look you are creating, of course.
I find it very interesting how different the MTF’s look at this higher frequency, compared to the lower. The Sigma still maintains excellent center sharpness but falls off more at the edges now into the yellow ‘borderline MTF’ zone. (It would be an excellent choice when you want a sharp center image with softer edges, not so much if you want an even look across the field). The Zeiss also maintains excellent center sharpness but at this frequency has better (and smoother) edge performance. You may notice the Samyang looks a bit asymmetrical, even in this average-of-all-samples plot. We’ll get into that when we discuss variation.
40 lp/mm
There is not a lot of difference change in pattern at 40 lp/mm compared to 30 lp/mm. All of the lenses have lower resolution away from the center now, as we would expect, but the change is more dramatic for some.
I encourage you to scroll back up to the 20lp/mm graphs to compare how, from a resolution standpoint, these lenses have different strengths and weaknesses depending upon the frequency you are considering. At lower frequencies, there’s no real argument that the Sigma and Zeiss have better resolution, but at higher frequencies, it’s not that simple. Which lens is best will really depend on what you are shooting and the look you want to achieve.
Full Field MTF Astigmatism Plots
The graphs above show the average of sagittal and tangential MTF, which gives us an idea of overall resolution. In the actual MTF data in the first graphs, though, you may have noted that sometimes the sag and tan lines were widely separated. This is generalized as astigmatism, but other factors, such as lateral chromatic aberration, can contribute to it. Nevertheless, a lens with that kind of separation gives a different look than you would get from a lens with little separation. We can graph the MTF’s astigmatism, just like we did the resolution above, and I’ve done that for 4 of the lenses.
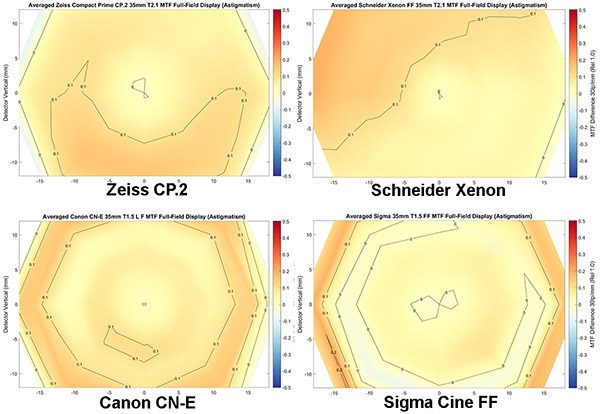
There’s not a lot of astigmatism in any of these lenses. If you look carefully, though, you see that the two T 2.1 Cine lenses on top have a fairly random pattern, while the two T1.5 photo-derived Cine lenses on the bottom show a bit more variation in a very mild ‘bulls-eye’ pattern. I’ll go ahead and answer your questions. First, this pattern is a bit more common in photo lenses and wide aperture lenses, but it is not a general rule you can live by. Second, the Xeen isn’t shown because the copy-to-copy variation made the graph weirdly random.
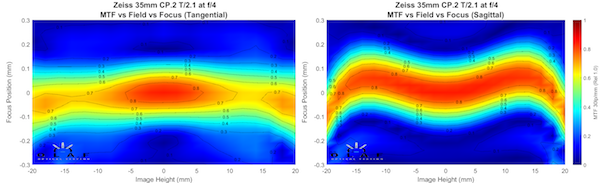
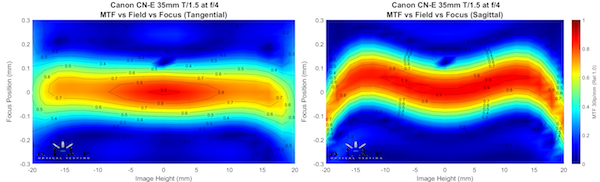
MTF vs. Field vs. Focus (Field of Focus) Plots
These graphs are useful in several ways. The most obvious are they show how the field of best focus curves across the field of view. It’s also useful when looking at MTF curves that fall-off, or show astigmatism in the outer edges. If the field curvature is also severe in that area, then field curvature explains some of the MTF results.
These are done at 30 line pairs / mm and at f/4 (which minimizes the effect of aberrations and shows a more accurate curve). If they were done at different apertures or frequencies, the depth of field would be greater or smaller. They are also examples of a single lens, not the average of 10 copies, so you will see some of the mild field tilts that cause some of the copy-to-copy variation in lenses at higher frequencies.
Zeiss CP.2 35mm T2.1
This curve is very typical for Zeiss lenses; a very mild curve of the tangential field and a stronger mustache curve of the sagittal field.
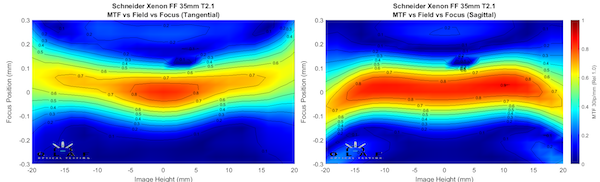
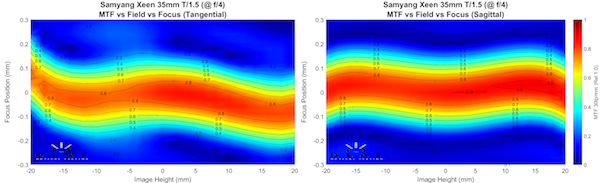
Schneider Xeen 35mm T2.1
Notice how the sagittal and tangential fields curve in opposite directions near the edge of the image, but otherwise overlay nicely.
Canon CN-E35mm T1.5 L F
The Canon field curvature is rather similar to the Zeiss seen above, but the tangential field is flatter and fades a bit more at the edges.
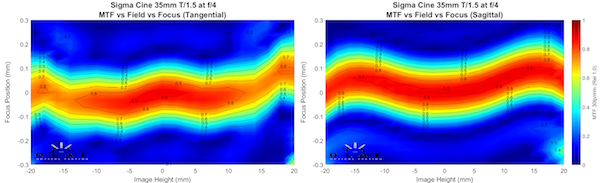
Sigma Cine 35mm FF
This copy of the Sigma shows a mild field tilt, but overall the curve shows a slight mustache in the sagittal field, with a mild U curve in the tangential.
Rokinon Xeen 35mm T1.5
This Xeen copy also shows a mild field tilt, more pronounced in the tangential field. You can also see it is slightly decentered.
None of these lenses show a dramatic field curvature that you’d need to take into account when filming.
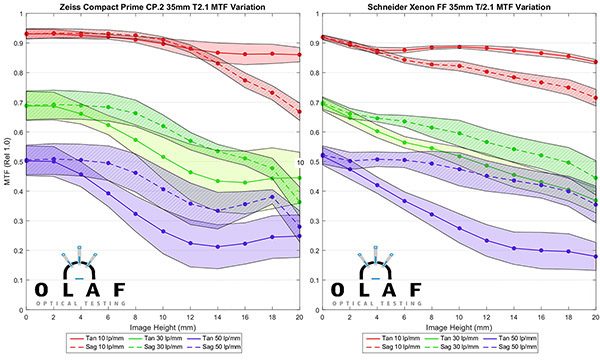
Averages are So Average
Let’s look at the variation range for each lens. This is the ‘spread’ of MTF results in the ten copies of each lens tested; the area in the graphs represents + and – 1 standard deviation. To keep the graph from getting too crowded, we just plot 10, 30, and 50 line pairs for these. First the T2.1 lenses.
One thing you will notice is there is very little variation at 10 line pairs/mm (red area), but quite a bit more at the higher frequencies (green is 30 lp/mm and purple 50 lp/mm).
Here are the two T2.1 lenses. Both are good, but the Schneider is exceptionally consistent.
Next, the T1.5 lenses. Experience with hundreds of photo has taught us that wider aperture lenses tend to have more variation. The Canon is surprisingly excellent, comparable to the T2.1 lenses. The Sigma has a little more variation. The Samyang has even more, particularly at higher frequencies.
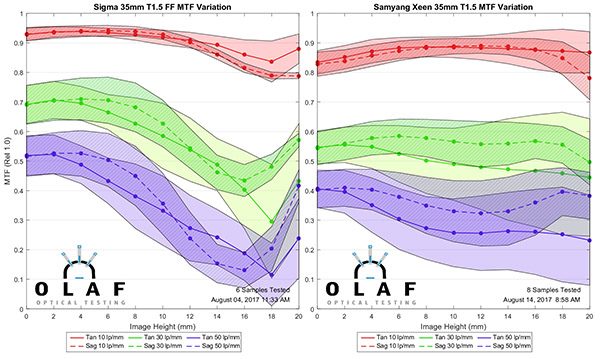
There are a couple of important examples made here about how this kind of testing translates to real-world images. First, look at the red, low-frequency areas. Four of the lenses have very little variation, while the Samyang has quite a bit more. Shooting at 1080p, this is what you would see; almost any copy of the first four lenses will appear excellent unless it has major optical issues.
But we do get complaints sometimes that a given copy of the Samyang lenses isn’t as sharp as expected, or appears to have some tilt. They are amazing values for the money, but at that price, it’s not reasonable to expect the consistency as a lens costing twice as much.
Full-field Variations
These are just examples of a few copies to give you an idea of what that variation looks like lens-by-lens.
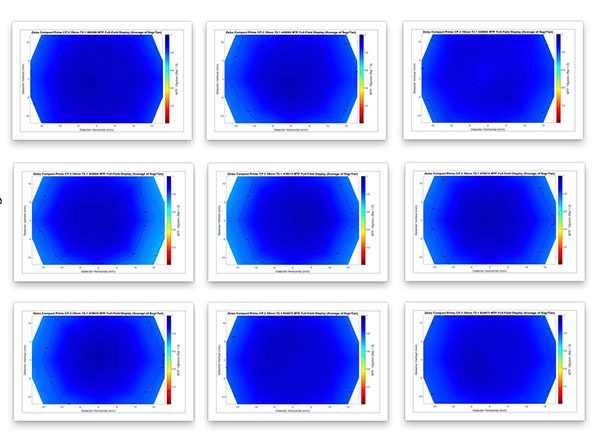
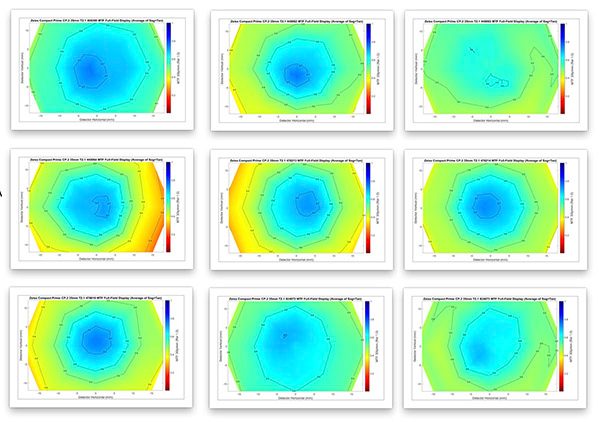
To keep the length reasonable, I’m not going to give examples of every lens we tested. I’ll use the Zeiss CP.2, which had little variance and the Samyang Xeen, which had the most. I’ll show the first nine copies I tested of each lens. Why 9? Because nine fits in the stupid little boxes I have to work with, that’s why nine.
Zeiss CP.2 at 10 lp/mm
These are just thumbnails, but you can probably tell that two copies in the second row have a small area of very slightly lower MTF along one edge. It’s really minor, though, and I’m comfortable it could not be detected in low-resolution video.
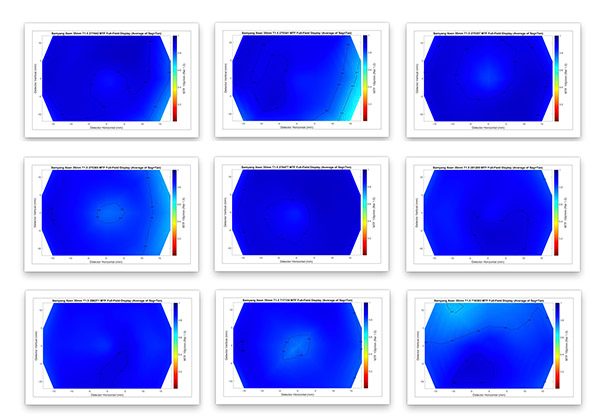
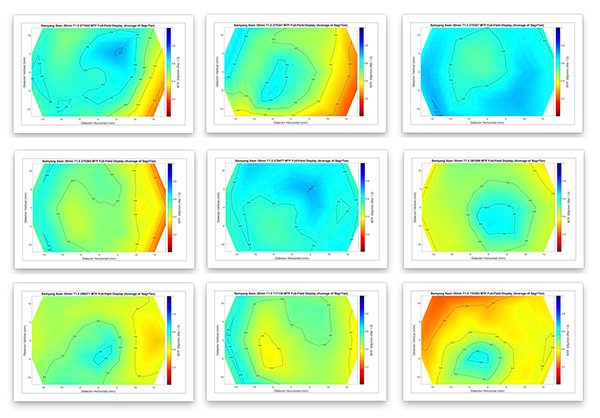
Samyang Xeen at 10 lp/mm
Things are only slightly different with the Xeen at 10 lp/mm. A couple have slightly lower MTF in small areas, a bit more than the Zeiss, but nothing you’d probably notice.
Next, we’ll look at 30 lp/mm frequency, which would be more appropriate if you’re shooting high-resolution video.
Zeiss CP.2 at 30 lp/mm
These are the same lenses, in the same order, as the thumbnails above. The same two edges that were ‘difficult to notice’ weak at low frequencies now show the yellow (MTF < 0.4) and orange (MTF < 0.3) that means you may notice this. To repeat, you might notice this if you’re shooting 6k or 8k, but you wouldn’t at 1080p. We also see the lens at the upper right doesn’t ever get dark blue in the center. If you had several of these lenses, and you made careful comparison on high-resolution video you might be able to tell this one wasn’t quite as sharp in the center as the other copies, but it wouldn’t be immediately obvious.
Samyang Xeen at 30 lp/mm
There’s some more obvious randomness here, and several of these copies, all of which appeared fine at low frequencies, are obviously not quite right testing at higher frequencies. One thing I want to point out, particularly: notice how the blue ‘sharpness center’ is pretty much in the center of each Zeiss lens. Now see where you consider the sharpness center to be located on the Xeens.
So What Did We Learn Today?
Well, first, I hope I learn a lot from your comments. This is the first Cine lens MTF comparison I’ve done, and I’ve shown some things I don’t always put in photo lens comparisons. There maybe more things I should include that I haven’t and I’m open to suggestions. Try to be reasonable with your suggestions, please. For example, the testing for this post is roughly 50 hours of work. Doing all of the lenses at every aperture would take another 60 to 70 hours, and I don’t have that kind of free time.
My takeaway message is that there are differences in Cine lens MTF that are utterly meaningless if you’re shooting at 1080p, but that may be deal-breakers when shooting at 6k or 8k. How much of a difference will they make at 4k? We can argue the theory a lot, but basically, it’s going to depend on what you’re shooting, at what aperture, with what kind of recording, how your audience is viewing it, and what kind of look you are trying to achieve.
As always, these are just MTF and resolution tests. There’s a lot more that goes into choosing a Cine lens than that. But as more and more people are shooting high-res video for audiences who aren’t looking at the footage on their phone or tablet, it is going to become quite important.
In practical terms, if you rent a Xeen for your 1080p shoot, you’ll certainly be happy with it. Even if it’s for your 4k shoot, you’ll probably find it acceptable. (Don’t mistake me, I don’t think ‘probably’ is an acceptable level of confidence.) But if you rent a pair of them, I expect you’ll notice the footage from the two lenses looks a little different.
For those who were expecting a summary that says ‘what’s the best 35mm full frame cinema prime lens’, that’s not what I’m trying to accomplish. I’m hoping to give you some information that helps you pick which lens will be the best for what you want to do. If you need the sharpest center and T1.5, I’m going to recommend the Sigma. If you want good edge-to-edge sharpness, the Zeiss or Schneider would be my first thoughts. If you want to spend all your budget on an 8k camera and then rent the least expensive lens you can put in front of it, then I’ll suggest you rethink your priorities.
Roger Cicala and Aaron Closz
Lensrentals.com
August, 2017

62 Comments
Florian Cramer ·
For cine lenses, focus breathing (i.e. its presence or absence) is one of the most important factors in deciding which lens to use. It would be nice to this aspect covered here…
etudiant ·
Would that not materially expand the scale of the work needing to be done?
Two positions at a minimum, with an apparatus to measure the angle covered at each.
Roger Cicala ·
It’s not something I can measure numerically on the optical bench. With zooms I can get a numeric parfocalness (is that a word?) measurement, but I can’t measure angle of view except at infinity focus.
Brandon Dube ·
The rigorous, field-of-view based version that is all-encompassing would be very time consuming. We cuold get one of the three pieces to it (and the biggest one) reasonably easily.
Three things contribute to breathing:
(1) change in focal length
(2) change in chief ray angle
(3) change in distortion
We can pretty easily measure (1) and I think it is the biggest contributor in relatively telecentric cine lenses. (3) I guess we could measure, but it would take a very long time. (2) we could measure if I designed an instrument to do it. A new instrument sounds expensive and like something Olaf doesn’t need right now, since we have a different new instrument I designed still in the calibration and verification stage.
DrJon ·
IMHO focal length at, say, three (maybe five if it’s trivial) focus positions, would be very interesting for all lenses (three zoom positions too). There’s always the “AF-S Zoom-Nikkor ED 70-200mm f/2.8G VR II” if anyone wants a laugh… (generally a good lens tho)
It would also be interesting to see what lenses agree with some formula, my attempt at this didn’t go well (trying geometry instead of the thin lens formula, you may remember).
Brandon Dube ·
geometrical optics (“thin lens formula”) and real lenses tend to match very closely — e.g. to within 0.3% — if you apply necessary corrections (shift image position by BFL, include pupil magnification in working f/#, etc.)
As the lens’ focus gets very close, the image may become extremely aberrated for an object at infinity (this damages the focal length calculation), and we may run out of travel on the focus axis of the MTF bench.
Chik Sum ·
It seems interesting about the Xeen lens perform all over the board for higher resolution, actually can you select a few of those and mount them on a still camera taking downloadable full size images to let us have a look at how they will look in a high res video screen capture?
and is it possible for some sample photos using a reference camera with fixed WB, and shoot something like portrait in candle light to demonstrate the “feel” of each cine lens? Personally I am only a stills photographer and not keen to take any video, but I can imagine in videos I would always go for how the scene feels (colour rendition, bokeh smoothness etc.) anytime than the pixel peeping sharpness, unless something weird like the bottom center sample of the Xeen lens which shows the edge is sharper than the center occurs
Roger Cicala ·
Chik, I totally agree that those things are most important; but many people more qualified and better at that than I already do it as they review lenses. I am not qualified to review lenses, I simply test them.
What we do is just test one small aspect. It’s usually not the most important aspect, but as we adjust to higher resolution it will become a necessary aspect.
YS ·
It seems interesting about the Xeen lens perform all over the board for higher resolution, actually can you select a few of those and mount them on a still camera taking downloadable full size images to let us have a look at how they will look in a high res video screen capture?
and is it possible for some sample photos using a reference camera with fixed WB, and shoot something like portrait in candle light to demonstrate the "feel" of each cine lens? Personally I am only a stills photographer and not keen to take any video, but I can imagine in videos I would always go for how the scene feels (colour rendition, bokeh smoothness etc.) anytime than the pixel peeping sharpness, unless something weird like the bottom center sample of the Xeen lens which shows the edge is sharper than the center occurs
Bumpy ·
In this, and I believe other posts, you refer to lenses with differing astigmatism as having a different look. I have a hard time visualizing that difference. I believe you use the ‘has a different look’ in other cases as well. Some I can visualize (sharpness falloff center to edge, simple field curvature), others I cannot (astigmatism, complex field curvature).
It would be helpful to have a post showing different looks. Not for every lens or test or attribute, just one for e.g. astigmatism generally that you could link to when you use that phrase. Even if not accurate for the specific lenses in a review, having a visualization of what it is about the look that changes when a given attribute varies would be helpful. Especially if you showed both range of differences when the attribute is in reasonable bounds, and what happens when it gets out of bounds to the point of being so visibly detrimental that the effect is pretty universally going to be considered defective.
Apologies if such posts exist and I missed them. Your tests are incredibly educational and helpful, thank you so much for all the hard work that goes into these blog posts.
Brandon Dube ·
if you shoot an email to technicalsupport@olafoptical.com, I’ll synthesize some images for you with different aberration content to show the difference between things. There’ll be a blog post on this stuff soonish, but not for a few weeks, maybe a month or two depending on my schedule.
DrJon ·
I’ll look forward to that. In the meantime I hope you won’t find if I ask for a cc of the e-mail? (I’ll make clear I’m not the OP.)
Bumpy ·
I am impressed by the offer of personal service, but I’d as soon you spend the time on a post that everyone can enjoy. Feel free to reply if you want me to be an alpha tester for the post. I’d be happy to offer whatever small assistance I may be capable of and that you would find helpful.
Brandon Dube ·
I already did a cluster of simulations for other people, if you send an email I’ll forward them along. Took 10 minutes, the post will take a lot longer.
Athanasius Kirchner ·
I’ll take you up on that offer, it’s always good to have an authoritative reference (for forum flamewars or helping newbies).
Joey Miller ·
Hey, send that to me, too, Brandon.
Michael Tiemann ·
Great stuff! They two things I’d like to see added are: chromatic aberration and smoothness of bokeh. The former is one of my biggest bug-a-boos (and has given me a great appreciation for $20k lenses vs $2k lenses). The latter could be measured in terms of “onion ring amplitude” of an out-of-focus point source. I love fast lenses as much as the next person, but I hate it when aspherical milling artifacts show up in what should be the soft spots of the image.
Roger Cicala ·
Well, we actually can measure longitudinal and lateral color, so we can add that next time. I can’t do a numerical valued for bokeh, but I can take images of how a point light source renders for OOF highlights, foreground and background. That’s easy enough.
Michael Tiemann ·
That would be great! BTW, what do you think about this for a breathing test: position two charts, one with a 1′ width and one with a 3-4′ width in such a way that the perspective from the nodal point of the lens (or some approximation thereof) “sees” the small chart side edges as perfectly lining up with the side edges of the large chart and with the top edge of the small chart aligned with the vertical center of the large chart. When you rack from the closer small chart to the farther large chart, you can measure the ratio of the apparent width of the small chart when focused close to the apparent width of the large chart when focused farther away.
Brandon Dube ·
Anything with charts is going to be a pretty emphatic “nope” right out of the gate — we’ve long moved past the pain of chart-based testing.
Your idea sounds like camera shake from focusing larger lenses will make it extremely difficult to get correct.
Michael Tiemann ·
Brandon, I don’t think you understand my suggestion. The “chart” need be nothing more complex than contrasting colors of foam core. It’s not about measuring lp/mm, but rather just looking at maintenance of image magnification at focal point extremes. Also, there’s no camera shake involved because this is not a dynamic breathing test. It’s measuring two points of a rack focus: near and far. The analysis of breathing can be done by measuring the relative image size of the near-focus object and the far-focus object.
Brandon Dube ·
I understand what you are proposing. The issue is not in the concept itself, but the implementation. There is no intentional camera shake involved yes, but for longer focal lengths you cannot avoid it. Even stepping on the ground near a 200mm or 300mm+ setup on a high resolution camera introduces multiple pixels of shake.
Carleton Foxx ·
Fie on your self doubt! You have already proven over and over that you’re the Galileo of Germantown, the al-Haitham of Atoka, the Leeuwenhoek of La Grange.
If anyone on the planet can come up with a measurement and corresponding numerical value for bokeh, it’s you and your equally talented colleagues. And, I bet you guys can do it in three beers or less.
Wilson Laidlaw ·
It would be very interesting to know how these $3.5k lenses compare with full professional cine lenses such as the Leica Summilux-C, Arri-Zeiss and Cooke, etc at multiples of the cost. I am aware that there are other factors involved in the cost of pro cine lenses than just the optical performance but do you get significantly better optical performance for the price.
Roger Cicala ·
Me too! Understandably it’s hard for me to do 10 copy tests on those, but we might be able to do some smaller groups.
Wilson Laidlaw ·
Look forward to it.
KWNJr ·
Thank you for a very interesting article – again.
Is it easier to manually focus a cine lens accurately compared with a ‘normal’ still camera lens – as from what I have read: cine lenses have a larger angle of rotation of the focusing ring (from infinity to closest focus) than ‘normal’ still camera lenses for a given focal length(except some macro lenses?).
While the requirements of cine vs still camera usage vary (still may prioritize speed of focus) – todays still cameras with ‘live view’ and zoom or loupe functions (to 100% – pixel for pixel of the image) – seem to allow very accurate manually focused images.
So, if you use manual focusing in the pictures you take, could a cine lens provide a better choice of lens (excluding cost)?
Roger Cicala ·
The longer and more accurate throw of Cine lenses make the manual act of focusing easier and more accurate. Still camera’s give very good live view functions, but the 3.5 inch LCD on the back of a still camera can’t compare with the 7-inch and larger monitors a cinematographer will be using.
A related, and interesting point, is the frequency / resolution at which one is focusing. The depth of field will be thinner at higher resolution which may make some difference, too.
Wilson Laidlaw ·
A super long throw is fine if you have a focus puller to do the job for you but if the focuser is also the man at the viewfinder and in charge of pointing the camera, it is easy to run out of wrist angle with a long throw lens and have to take two bites at the cherry. I find this with my Leica 85mm/f1.5 Summarex, which has a very long throw focus ring.
KWNJr ·
You are right about 3.5″ LCD’s – but if you connect, say, your iPad to the camera (wired or wi-fi) you can have a larger display. Say a 9.7″, 10.5″ or 12.9″ iPad.
Of course the camera must be able to support this.
Omesh Singh ·
Cine lenses tend to have a wider focus ring on the lens barrel.
circumferential distance = radians x radius
Ralph Dum ·
I would really like to understand why ‘cine-lenses’ are so much more expensive than other lenses.
Are they optically so much better? Or mechanically? What is their additional value which makes them so much more expensive?
milkod2001 ·
They are made in very small batches, every single one is properly manually tested and optically they are usually much better than other lenses.
Brandon Dube ·
For a lot of the lower end cine lenses on the market, they are certainly not all “properly manually tested.” Optically better is not clear between the two — the design goals are often very different.
Roger Cicala ·
Actually, when we compare optically-same cine and photo lenses, like Zeiss CP.2 to Milvus, Sigma Cine to Art, Canon CN-E to Canon L, that isn’t true. I’ll write it up when I get time, but while there are a few where the difference is noticeable, it is NOT the majority. Not even a big minority.
Samuel H ·
Eagerly awaiting that post
Lee ·
Wow, you can certainly add that to the list of bombshells you’ve dropped that the manufacturers aren’t happy about!
Apparently Zeiss has been *claiming* the CP.3 aren’t straight rehouses like the CP.2. Add that to your list of claims to check 😀
Roger Cicala ·
We haven’t gotten enough CP.3 yet to do that testing. But it’s on the list. The CP.2, though, are optically identical.
Lee ·
Yeah, with the CP.2 I don’t think they ever claimed otherwise (except insofar as the “lower sample variation” idea, which might have just been forum speculation Zeiss never actually claimed).
Wei Yan ·
hi , are these tested lenses brand new ? These comparisons make no sens unless the tested lenses are brand new or within factory spec, because you never know what these lenses went through when being rented out.
Brandon Dube ·
Always out of the box from the vendor (B&H, other stores, never direct from mfg.) A small percentage get screened out of that as obvious duds, dropped in shipping or otherwise already damaged.
Samuel H ·
Hi. One very quick thing to check, now that I thought about it… You’re testing the lenses with focus at infinity. How accurate is the infinity focus mark on the lens itself? This is supposed to be one of the biggest advantages of cine lenses…
Brandon Dube ·
For a well cared for cine lens, the focusing ring is accurate to some fraction of a degree of rotation. Over time or with misuse, this will drift and is something that requires regular maintenance, especially if the lens has an interchangeable mount system.
If you want to e.g. take the lens to Antarctica, you should calibrate the focus ring at that temperature and pressure as the lens will behave differently over wide temperature shifts.
Samuel H ·
Wow, so much nuance. Thanks.
Mike Earussi ·
I realize how labor intensive it would be to test a lens at every aperture, but when you only test them wide open you’re always showing them at their worst. Would it be too much trouble to add just one more aperture test say at f4 or f5.6 which is usually the sweet spot for all good lenses?
Brandon Dube ·
If a customer wants to pay for us to take measurements at any aperture, we will. For a single lens and aperture, the cost is $125 for MTF.
What we provide freely on the LR blog is a product of work we’re doing anyway for our own purposes, and that workflow won’t change without a better motivation than “people would like to see the results.”
Roger Cicala ·
Mike our goal is to show lenses at their worst. There’s plenty of information out there showing them at their best.
Everything looks pretty good at f/8, so rather than me redoing all the testing, we could pretty much just add “but by f/8 it’s wonderful” at the end of every blog post 🙂
Mike Earussi ·
Not all lenses are wonderful by f8. And some lenses that look bad wide open in comparison to others can be better than those other lenses when stopped down two stops. For instance if I were to use your tests here to pick a lens I would conclude that for FF 4K video the Zeiss would be much better than the Sigma because of Sigma’s poor FF edge performance. But I’ve seen instances where Sigma, once stopped down, is actually better than Zeiss. And how many people shoot video wide open anyway unless they’re shooting in low light or want a shallow dof. A more realistic or “common” aperture would be between f4-8, so something in this range would be much better for evaluating a cine lens for real world use.
Now I did not realize, until Brandon told me, that your test info was just a byproduct of your normal testing procedure done for your own use–I always thought it was done specifically for the articles you wrote here. So yes I now realize it would take time away from your normal work flow and cost extra. But still since you do rent these lenses increasing the available info for your customers could help them decide which lens they’d want to rent. It would certainly help me.
Roger Cicala ·
Mike, you are correct and I was being a bit facetious. We have considered doing something like a token test at closed apertures, say taking one copy that’s about average and doing it stopped down. But there’s no way I can afford to do a 10 copy set at stopdowns. To give you an idea, the lenses in this post took about 50 hours of bench time, so that’s 50 hours of a tech, 50 hours rental on a $200,000 optical bench, and then I write them up after work. Brandon’s price below isn’t one that makes us a lot of money, it’s just above break-even.
Mike Earussi ·
One lens is better than nothing and is usually all we would need, after all that’s what every other lens testing site provides.
Lee ·
My 2 cents, for the 1 cent they’re probably worth: I’d add “matched aperture” (in this case, putting the 1.5 lenses at 2.1) before I added “stopped down to a point where [like you mentioned] most differences will be hidden.”
Mike Earussi ·
One more question: you mention 10 lpm as a good check for 1080p, but what is the important resolution for 4K?
Brandon Dube ·
Depends on the sensor size. for Super 35, 40lp/mm is pretty close to half nyquist. I would say 10lp/mm, for S35/4K, is the contrast and clarity of the image, while 40lp/mm or 50lp/mm is how much detail there is under closer inspection.
Samuel H ·
Thanks! So, for full frame 4k, 10 lp/mm for contrast and 30 lp/mm for detail.
Brandon Dube ·
That’s about right. The FF image does have detail up to 60lp/mm, but few things you photograph actually have information at those frequencies of sufficient amplitude to have much sensitivity to the MTF (e.g. .6 and .3 might be indistinguishable).
Carleton Foxx ·
So at what frequency does a lens resolve highly specular highlights, very fine edges (like the edges of metal objects or crisp fabrics) and JJ Abrams-style lens flare. For me getting good rendition of those kinds of features is what give video the illusion of being sharp.
Brandon Dube ·
Specular highlights can be both well and poorly defined, so there is not a clear notion of spatial frequency associated with them. A perfect edge contains all spatial frequencies at unit amplitude, so the answer for “a very fine edge”, on these plots, would be at least 40 or 50cy/mm, if not higher.
Flare is a separate issue and these results are not directly relevant to it.
Carleton Foxx ·
Thank you. I meant specular from point sources on a highly reflective surface. And is 40cy/mm different from lp/mm?
Brandon Dube ·
A point source that is truly a point contains all spatial frequencies with unit amplitude, just like an edge. The edge is directional, while the point is not.
cy/mm is the same as lp/mm, it just doesn’t imply a set of bars/lines.
Carleton Foxx ·
Thanks for sharing your amazing depth of knowledge. There is so much bull being pumped out by camera websites that the world really needs two or three of you.
riki ·
I like this, but I hope you find a chance to test the more consumer priced ones. I certainly expect them to not perform as well, but how much worse? Or what resolution is probably a good upper limit for them. I was thinking of the $500 -$1000 cine lenses that many us can only afford.
Thanks
MusicIsMath ·
Wow, this is a great test! Thank you for all the work you guys put into it!
Kudos for measuring field curvature on the lenses, most lens tests dont!
One question: Is it possible that you are actually measuring the wierd field curvature of the sigmas as the optical performance? It seems to me that it has the “mustache” part more or less where you measure the abrupt drop in sharpness towards the edges and it also seems to match the pattern that it has better lower-frequency performance but drops in the higher frequency detail, as you would expect that on the edge of the DOF.
This may be an inane question because I guess the same could be asked about the rest of the lenses as well, the testing methodology that is used on all lens tests does not seem to differentiate between general optical performance and field curvature issues.