This is the first post of a series of posts publishing all of our MTF results so that methodology is consistent, easy to find, and up-to-date. (For some of the older lenses there are graphs done with older software floating around. For a couple of lenses there are incorrect graphs done before we worked out all of the details for sensor glass in the testing pathway. These are all current.)
Otherwise, there are no comparisons, no commentary, just the test results for you to use and abuse as you see fit. The major purpose is just to get these MTF charts organized and in one place where you can find them.
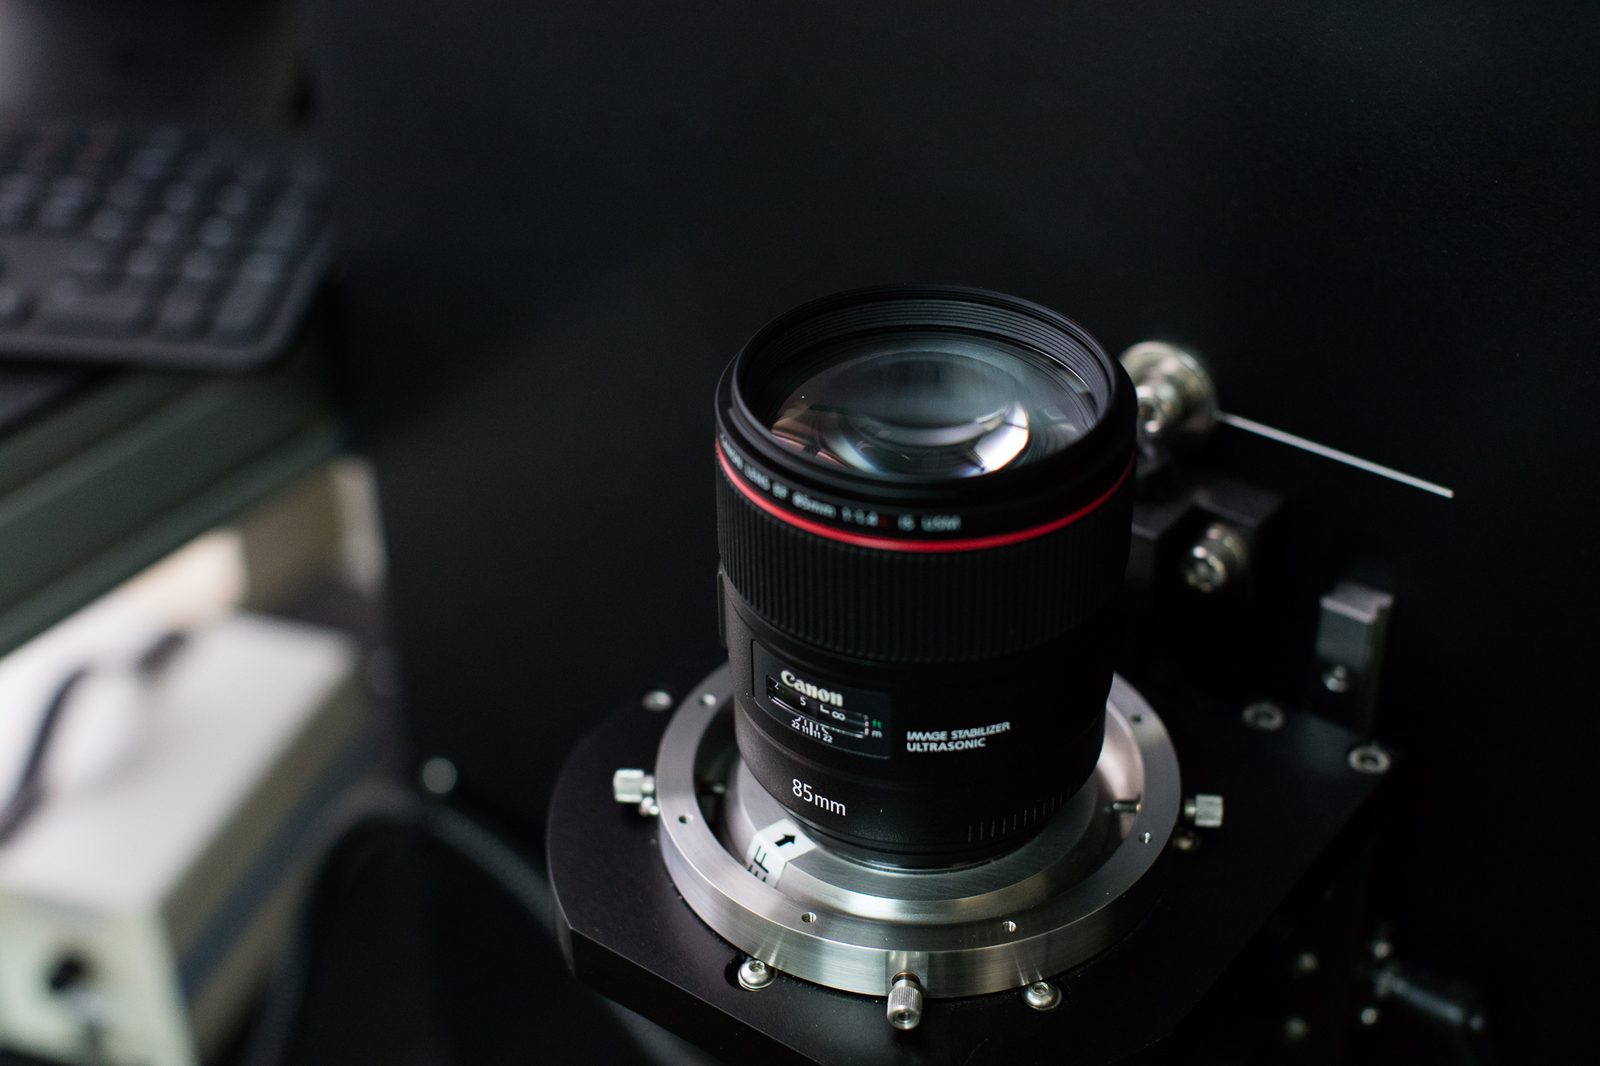
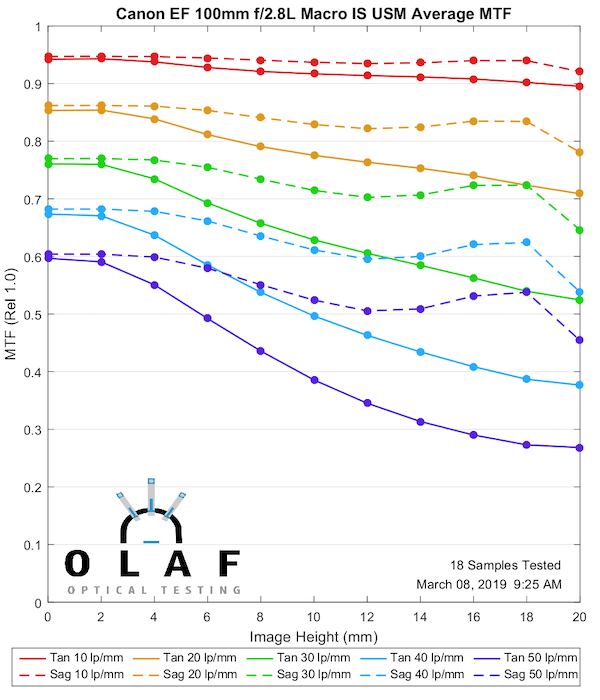
Just to avoid 4,200 comments: these are all average MTFs from multiple copies. They are all measured at the widest aperture. Yes, I know you’d like several apertures. I haven’t got the time or money to do that. Sorry.
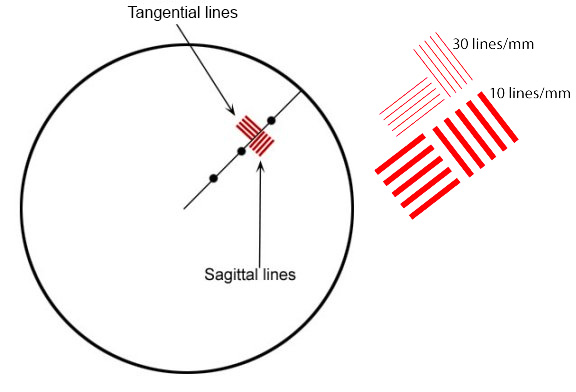
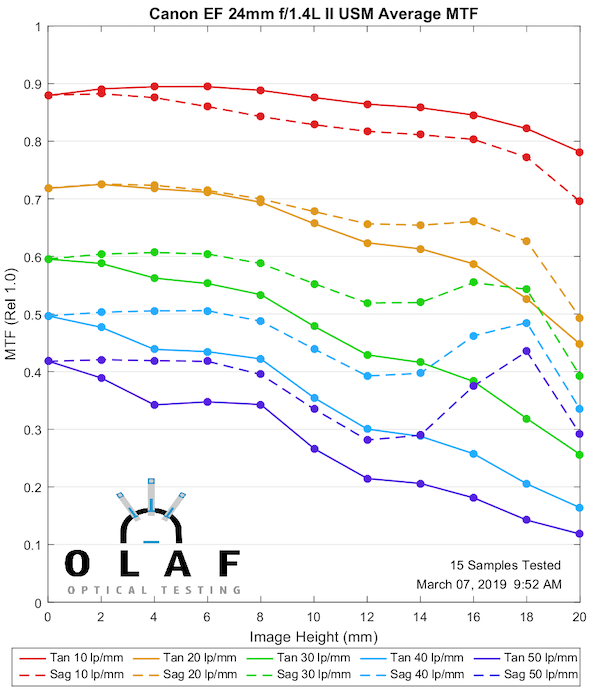
A Quick How to on Reading MTF ChartsIf you’re new here, you’ll see we have a scientific methodology to our approach, and use MTF charts to measure lens resolution and sharpness. All of our MTF charts test ten of the same lenses, and then we average out the results. MTF (or (or Modulation Transfer Function) Charts measure the optical potential of a lens by plotting the contrast and resolution of the lens from the center to the outer corners of the frame. An MTF chart has two axis, the y-axis (vertical) and the x-axis (horizontal). The y-axis (vertical) measures how accurately the lens reproduces the object (sharpness), where 1.0 would be the theoretical “perfect lens”. The x-axis (horizontal) measures the distance from the center of a lens to the edges (measured in millimeters where 0mm represents the center, and 20mm represents the corner point). Generally, a lens has the greatest theoretical sharpness in the center, with the sharpness being reduced in the corners. Tangential & Sagittal LinesThe graph then plots two sets of five different ranges. These sets are broken down into Tangential lines (solid lines on our graphs) and Sagittal (dotted lines on our graphs). Sagittal lines are a pattern where the lines are oriented parallel to a line through the center of the image. Tangential (or Meridonial) lines are tested where the lines are aligned perpendicular to a line through the center of the image.
From there, the Sagittal and Tangential tests are done in 5 sets, started at 10 lines per millimeter (lp/mm), all the way up to 50 lines per millimeter (lp/mm). To put this in layman’s terms, the higher lp/mm measure how well the lens resolves fine detail. So, higher MTF is better than lower, and less separation of the sagittal and tangential lines are better than a lot of separation. Please keep in mind this is a simple introduction to MTF charts, for a more scientific explanation, feel free to read this article. |
Canon Prime Lenses
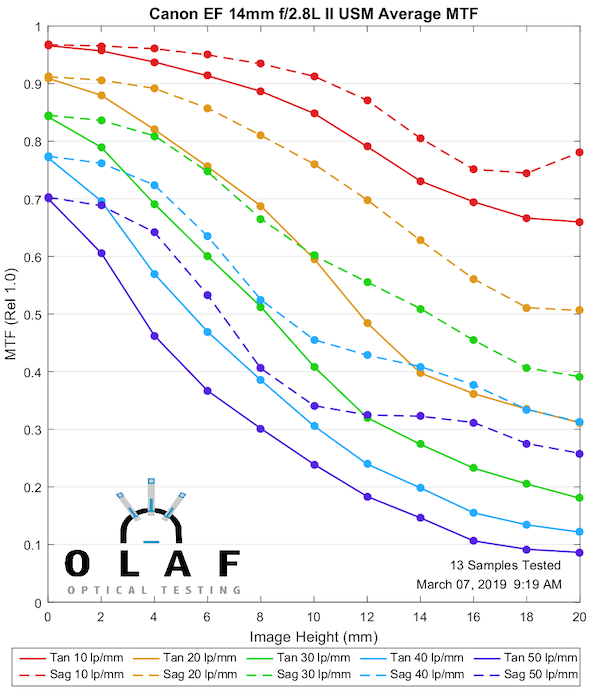
Canon 14mm f2.8 L MkII
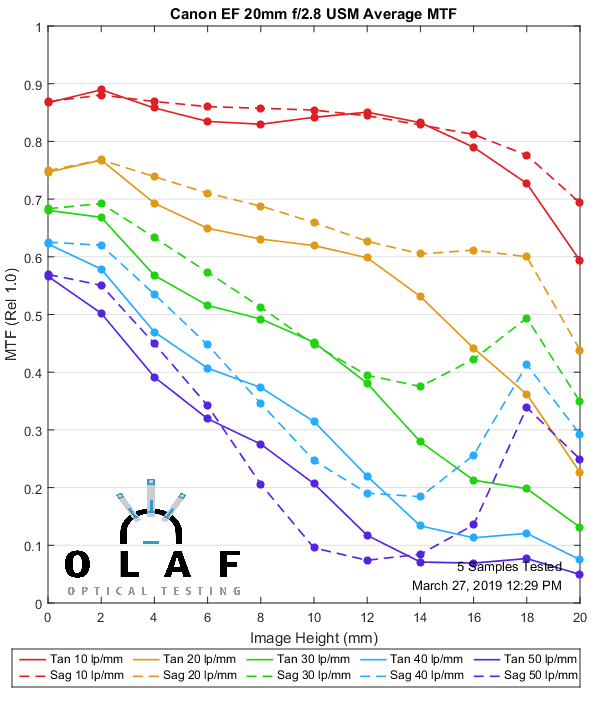
Canon 20mm f2.8 USM
Canon 24mm f1.4 L Mk II
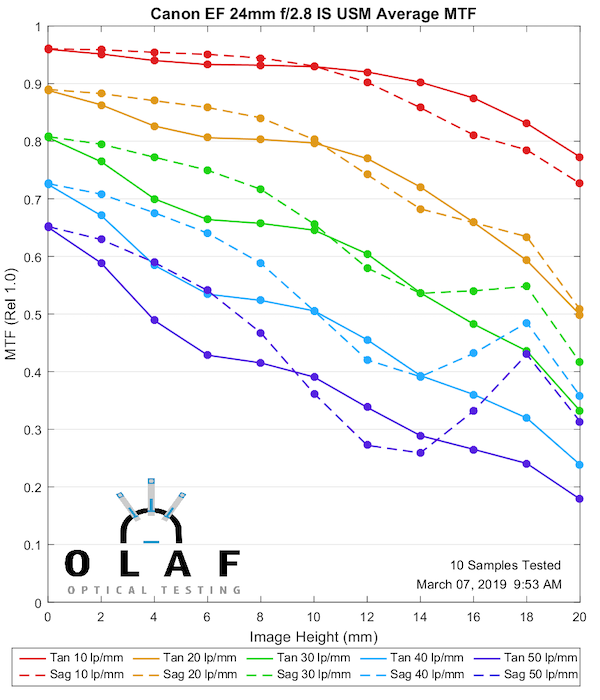
Canon 24mm f2.8 IS
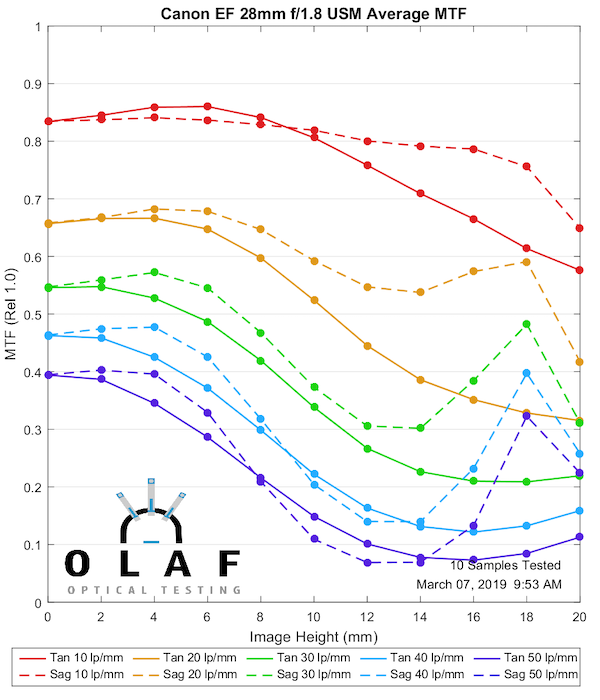
Canon 28mm f1.8
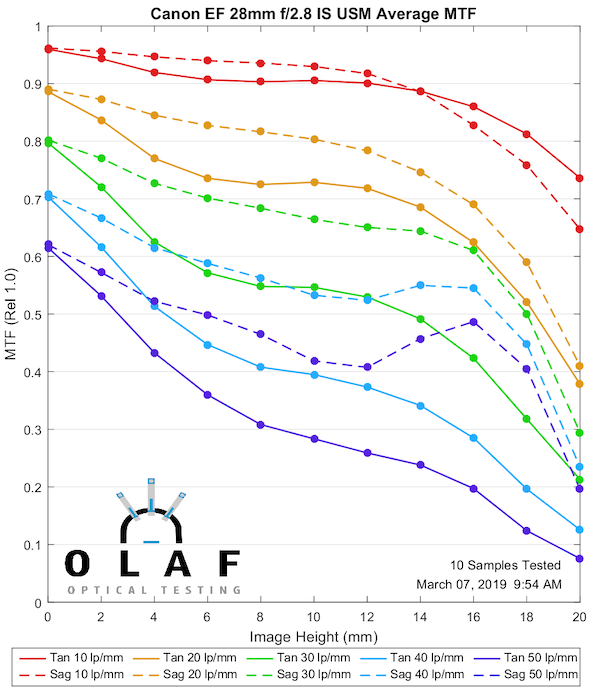
Canon 28mm f2.8 IS
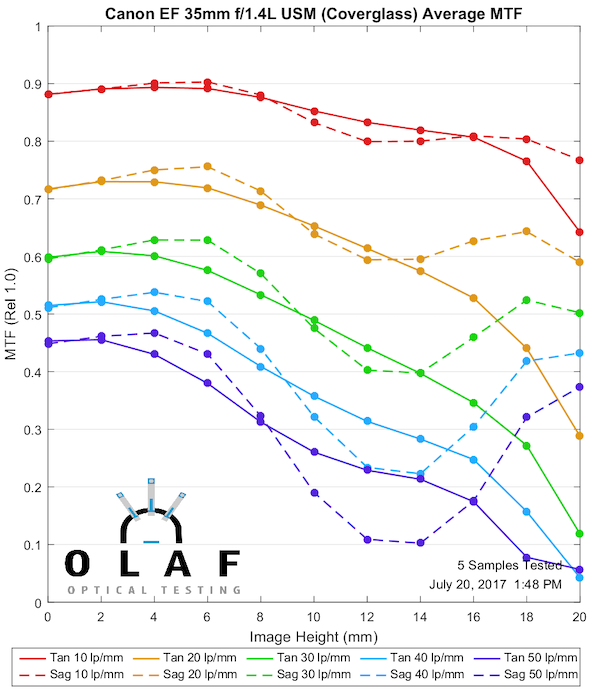
Canon 35mm f1.4 L
Note – this is a 5 sample chart because we didn’t have many left when we retested for proper cover glass thickness.
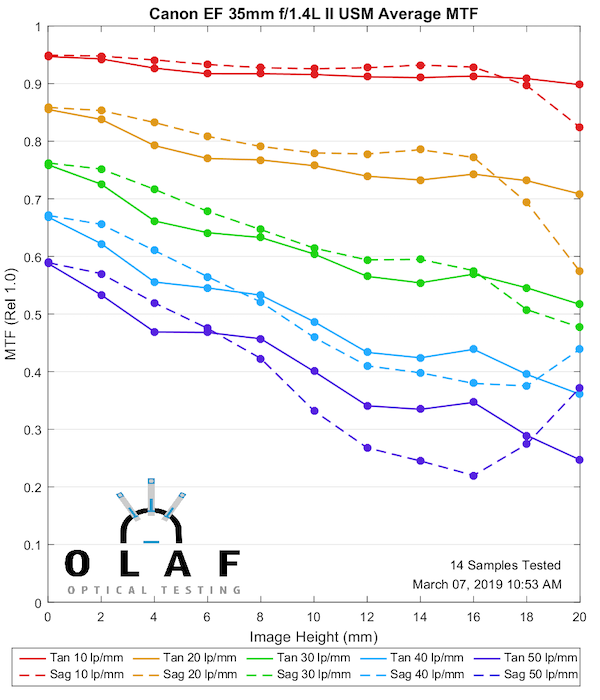
Canon 35mm f1.4 L Mk II
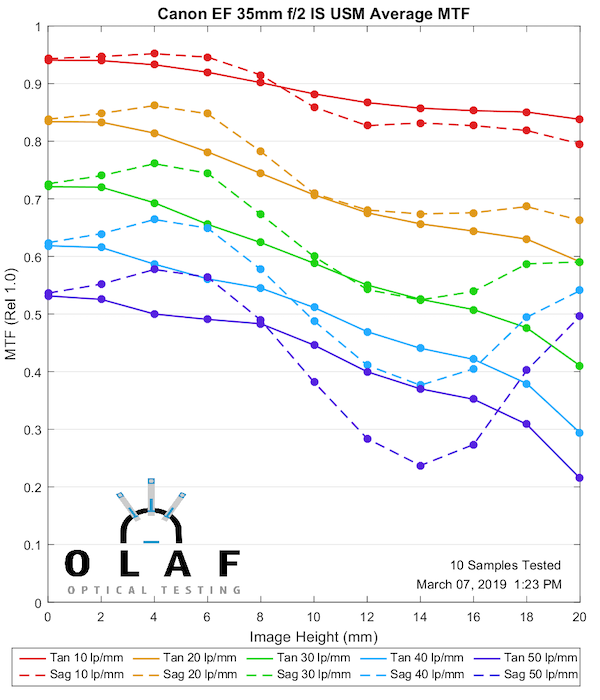
Canon 35mm f2 IS
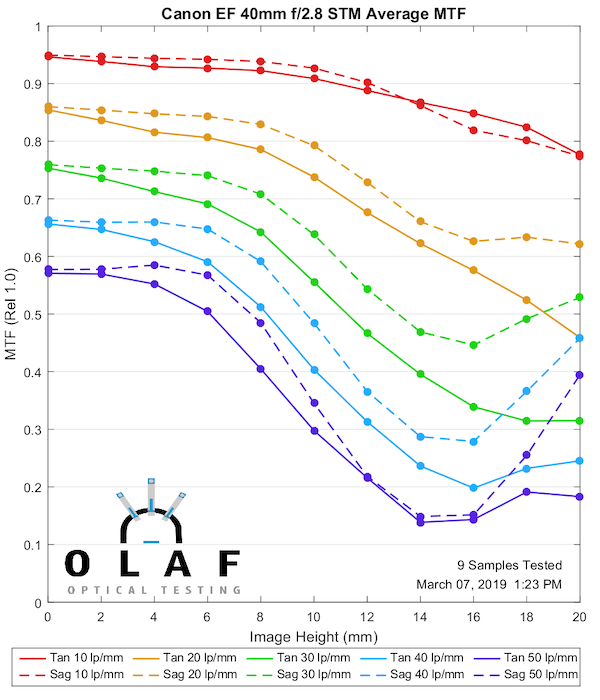
Canon 40mm f2.8 STM
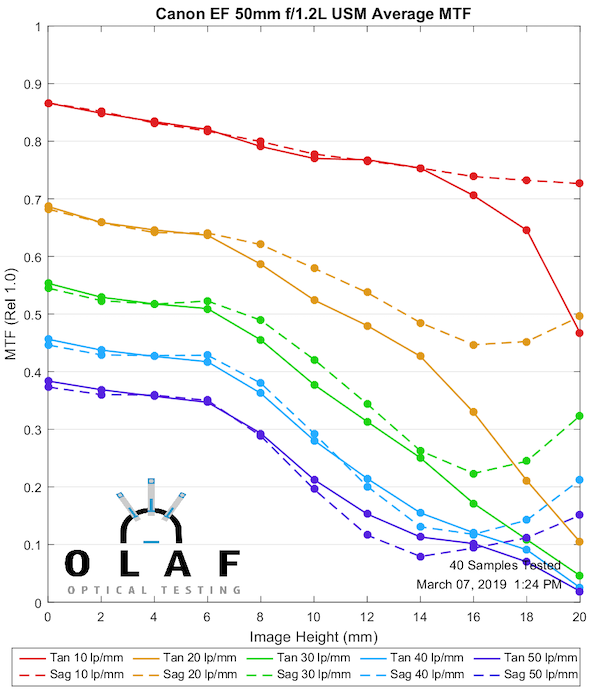
Canon 50mm f1.2 L
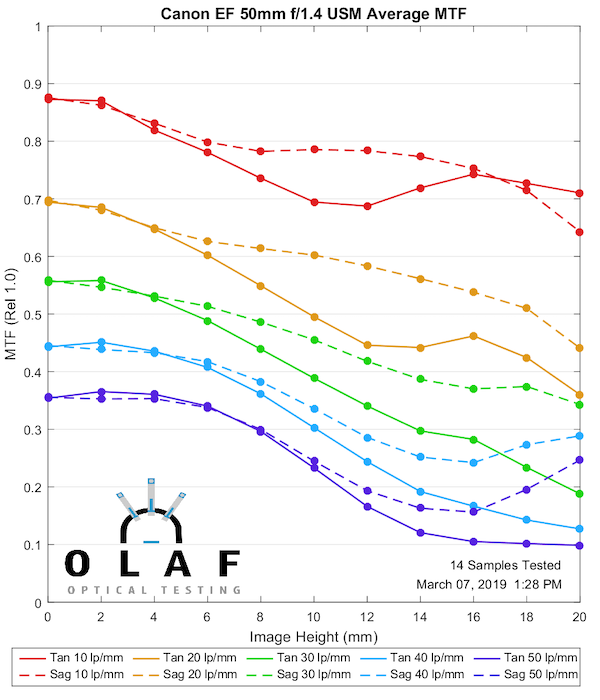
Canon 50mm f1.4
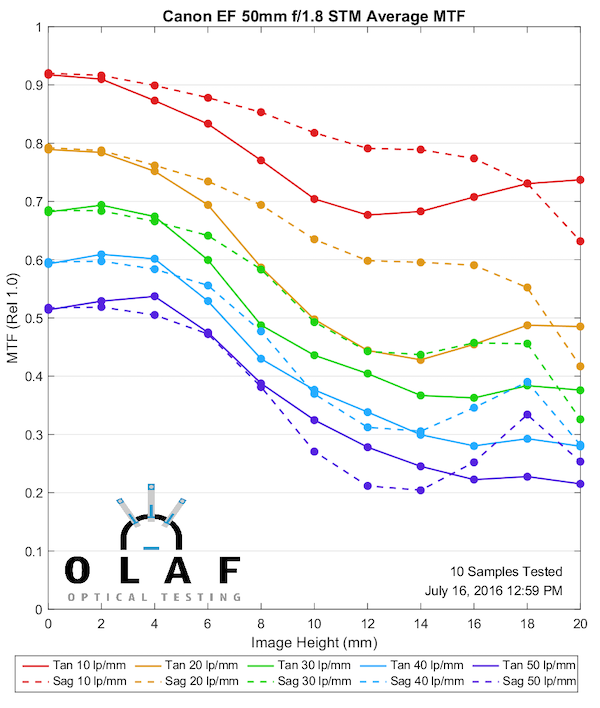
Canon 50mm f1.8 STM
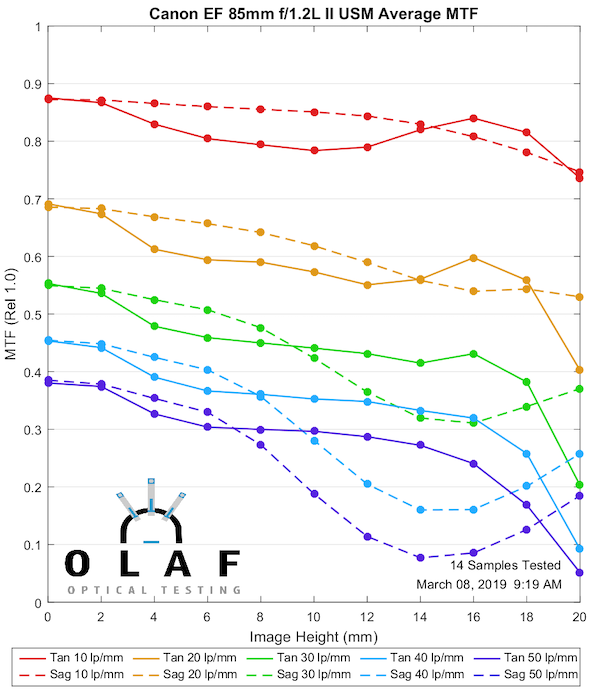
Canon 85mm f1.2 L Mk II
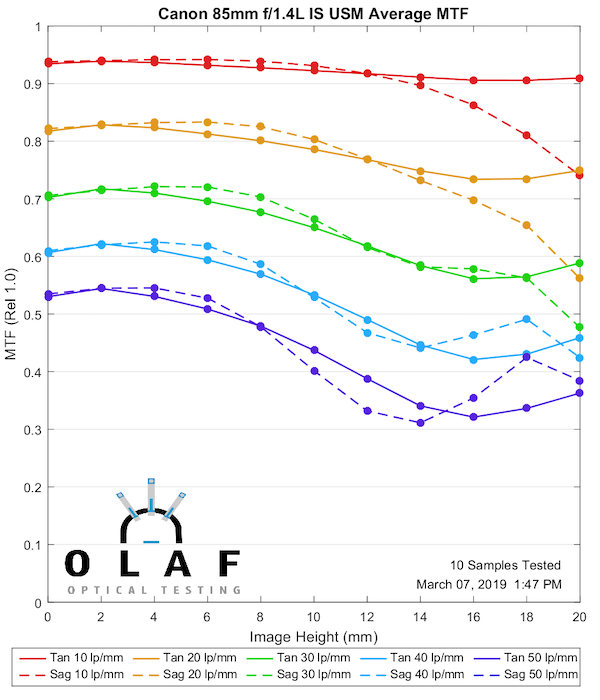
Canon 85mm f1.4 IS L
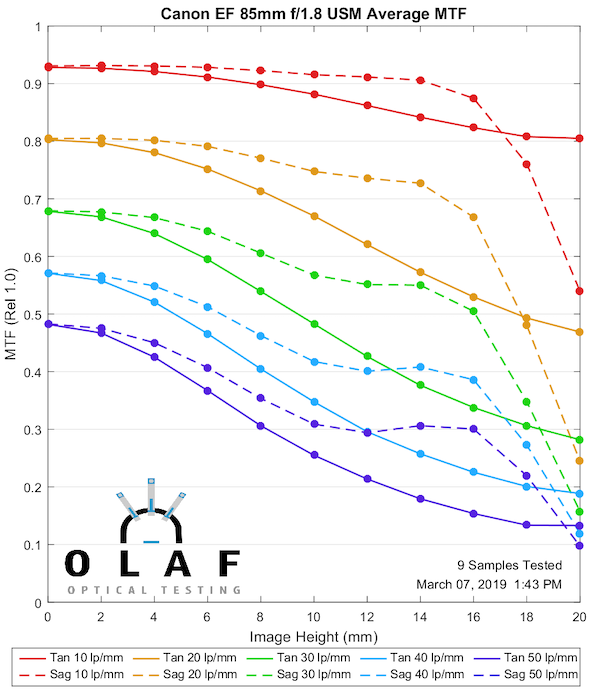
Canon 85mn f1.8
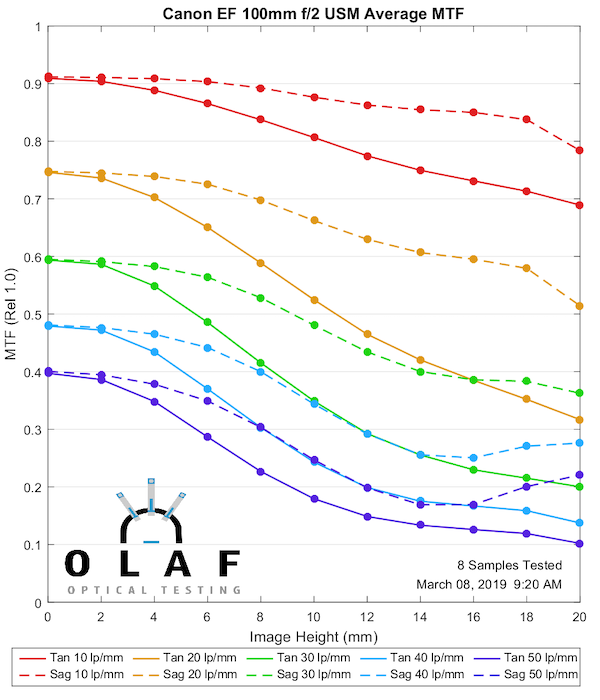
Canon 100mm f/2
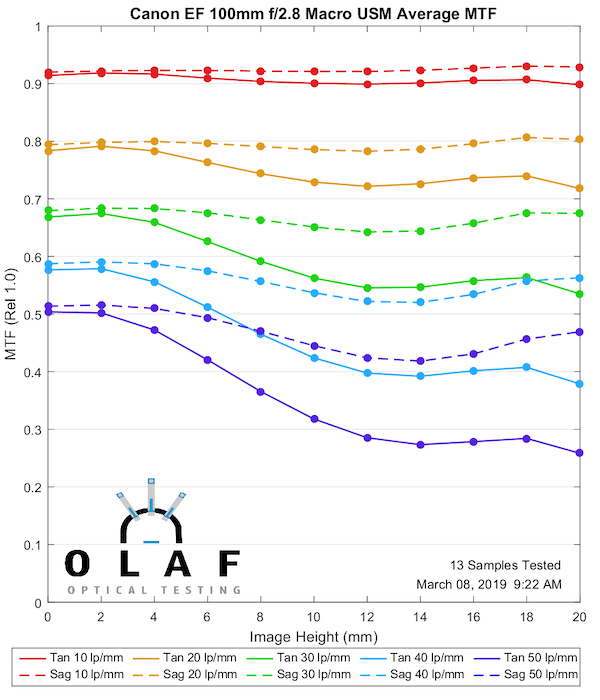
Canon 100mm 2.8 Macro USM
Canon 100mm f2.8 Macro IS L
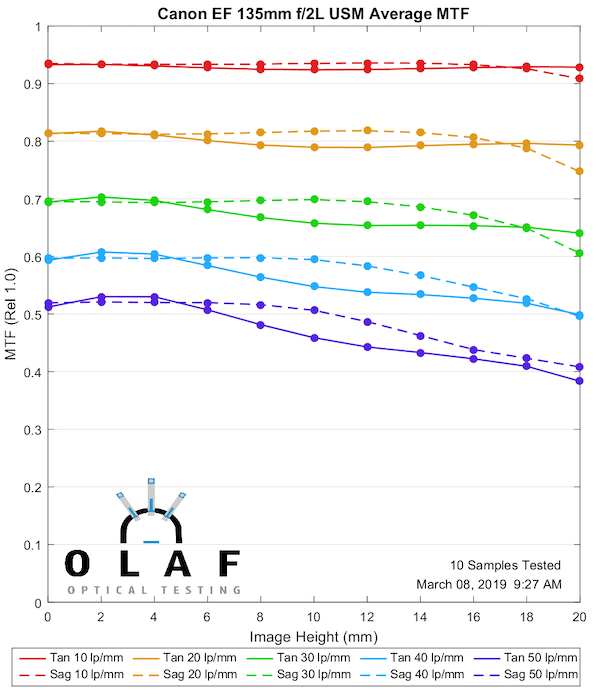
Canon 135mm f2.0 L
That’s all the Canon primes we have done except tilt-shifts, which will come out separately.
For a look at all the Just MTF Articles we’ve done so far, be sure to check them out here.
Roger Cicala, Aaron Closz, and Brandon Dube
Lensrentals.com
March, 2019

74 Comments
Samuel H ·
It’s official: I’ve been spoiled by Sigma
(Thanks for these!)
Ed Hassell ·
Thank you for all your hard work. A few surprised me. Others were pretty much as I expected them to be.
I’m mainly a Nikon shooter (hint for a similar post of Nikkor optics); however, I have used Canon equipment belonging to friends often over the years. I figure the two companies are more similar than different and leap-frog each other with their technologies from time to time. I’m way too invested in glass that I have no desire to replace to switch systems just because someone has a better widget this year.
Brenda ·
Most recent poll shows that more than 75% people are occupied into online jobs. Online world-wide is becoming bigger and better and bringing an ample amount of money making opportunities. Working at home on line tasks are trending and transforming individual’s everyday lives. Exactly why it really is extremely popular? Mainly because it allows you to work from anywhere and any time. You receive more time to spend with all your family and can plan out tours for holidays. Persons are generating great income of $22000 each week by utilizing the efficient and smart approaches. Carrying out right work in a right direction will always lead us towards success. You can start to earn from the 1st day after you browse through our web-site. >>>>> PLU.SH/njexd
Roger Cicala ·
Ed, we’ll have all the primes out by brand and mount within a couple of weeks. Then I’ll start the zooms.
Florent ·
Thanks for the hard work, Roger et al. Any chance we will see some Fuji charts as well?
Roger Cicala ·
It’s all about getting the mount made, which I know I’ve been saying for a year. But it’s actually at the machinist now.
Someone ·
What about Canon and Nikon mirrorless mounts? Are these in the works too?
Roger Cicala ·
They are, although we’re still waiting on parts for those. Making the mounts is pretty complex: we need a camera mount, the lens bayonet, the electronics for both. Then the camera mount has to have an optical bench plate machined to receive it which can be a bit complex and is to really high tolerances. After all that is done we have to shim the mount to the plate so it’s optically flat and wire everything together in a way that still lets the plate rotate 360 degrees.
That requires sacrificing a lens and at least an adapter; we’d obviously rather sacrifice a well used one of each.
Devil's Advocate ·
Ask the manufacturers / internet for dead ones to cannibalise 🙂
Alan Fersht ·
All the primes you have done? What about the 400mm f/2.8 II and the 400mm f/4 DO II?
https://www.lensrentals.com...
Joe Blow ·
To my untrained eyes, the 135mm f2 looks pretty darn good. Maybe this is why Canon hasn’t upgraded this lens for years.
Hunter45 ·
And thankfully I have one…….
bokesan ·
Even if you compare it with the new Sony: https://www.lensrentals.com... Well, only the edges, but still, very impressive.
Frank Sheeran ·
I’ve had mine since 1998 and yes, it has always been totally different than ALL other Canon lenses, except maybe the 180 mac and the white telephotos. I had well over $10k of Canon glass when I got the 135 so you’d think I’d know what sharp looked like but I was totally blown away. A shot from the first roll onto Velvia* had a friend whose head height was like 1/8th the height of the shot… 3mm on film if so… and I could count her individual hairs. It wasn’t even being able to see them, I could practically FEEL them. And given the bokeh the results can look almost 3D.
I haven’t put my new RF 50/1.2 through the wringer yet but I’m expecting it’s in the same category. More generally I think a lot of makers are making lenses this good. 135, 85, and (mirrorless) 50 are the easiest formulas to make sharp I think, as you don’t need retrofocus (as seen on wide-angle SLR lenses), don’t need a wide angle of output from the back (as seen on wide-angle non-SLRs), don’t need a design to sacrifice quality by being artificially compacted from the ideal (200mm and longer). I won’t/can’t say the 135/2 is better than the other 135s now available, but it’s still surely better than the other EF lenses.
(*she was Asian and Asian skin tones are fine on Velvia, though no-one else is.)
Ernest Green ·
Agreed but I think it’s generally easier for longer lenses to achieve across-the-frame sharpness at large apertures than it is for narrower lenses. Light bending and all that. I’d love to see stop down tests for these lenses. In prior LR articles, they say they perform stop down tests from then on, but they are seemingly no where to be found on the site. I only saw one lens where they tested at f/5.6. Personally I’d be interested in seeing how lenses perform just one full stop down, not necessarily 5.6. Many large aperture lenses that are “meh” wide open (say 1.4) tend to spectacularly improve at F2.
Roger Cicala ·
Alan, if you recall that article, I made people swear a solemn oath before reading it not to take it out of context: the bench was over its supposed limits and the number of copies were low – it was an experiment. But, of course, people made all kinds of silly statements that all started with “Roger Cicala showed”. So I’m not going to put experimental results in here with things that I feel the results are scientific.
It would just give more fodder to the Fanpeople. Fanpeople are why we can’t have nice tests.
dadohead ·
“Fanpeople are why we can’t have nice tests.” LOL. A most excellent Rogerism.
Alan Fersht ·
Your measurements on 6 copies of the 400mm f/2.8 II, 8 of the 400mm f/5.6 and, admittedly, just 2 of the DO II on an adapted optical bench may not be up to your usual standards but are far, far more credible than the one-off measurements of single copies using charts under ill-defined conditions that is the stock-in-trade of virtually every other lens-testing site. And you did state the caveats.
Alan Fersht ·
Your MTFs for the 400mm f/2.8 II (and 100-400mm f/5.6 II) are reproduced under your license and without prior oath taking by The Digital Picture https://www.the-digital-pic...
xeppelin ·
sorry, if i overlooked it, but don’t see at what f-stop … all charts for lens wide open?
Max Manzan ·
All tests wide open at infinity.
Brandon Dube ·
All at full aperture. The “chart” is infinitely far away.
Unrest ·
With that in mind, is it safe to assume a lens designed to perform better at closer distances vs. infinity would be at a disadvantage using the optical bench MTF data?
Brandon Dube ·
I think “disadvantage” probably isn’t the right word, but it won’t be putting its best foot forward, yes.
frank ·
I wonder how these MTF charts compare to the much easier to read charts on opticallimits.com?
xeppelin ·
hehe, fully confirms my opinion, that EF 40/2.8 STM and 50/1.8 STM deliver max. bang for the buck.
Ernest Green ·
Thank you! Great list. I understand you can’t test all apertures on all lenses, but for a point of reference, could you take a middle of the road lens such as say, the 100 F2, and test it at f/5.6? I am curious what the 50 line pair would be? Over 5? In other words, can a number of lenses, if not most, achieve a score of over 5 with the 50 line pair test? Cause for me, I use a lot of these lenses for landscape stuff where i wouldn’t shoot them wide open. So it would be nice to see how fine detail is resolved at 5.6 (the most common sharpest aperture for full frame glass)
Roger Cicala ·
In the center, yes almost all can. Most primes do easily at f/2.8. Towards the edge many primes can reach that at f/4, and some zooms at f/5.6.
Michael ·
Are you sure you are measuring the 85mm 1.2 L instead of the 85mm f1.2 L Mk II? I ask because all your other lenses are the latest versions.
Roger Cicala ·
Woops. I’ll add a text to show that. Thx.
Hunter45 ·
And the 85 1.8 is listed as: “Canon 85mn f1.8”.
Frank Sheeran ·
85/1.2 II was identical to the I. This is an old-school design, double-Gaussian. It differed slightly from the more compact FD lens of the same spec. http://blog.interfoto.eu/20...
Andreas Werle ·
Thanks for this Roger! Did you realy test 40 Samples of the 50/1,2, perhaps a writing error? Greetings Andy
Roger Cicala ·
Actually tested way over 100. That’s just the subset I grabbed for charting.
Brandon Dube ·
Do you have an address? I’d like to send you a cookie in the mail for actually reading the chart!
JJason Lee ·
Nice work here. Wonder if you would be doing the same for super-tele photo lenses?
Roger Cicala ·
Most are too big to test on the optical bench. It has size constraints. We can work around them, but since we’re technically overloading the bench the results are questionable.
Jason Lee ·
Thanks and understood the constrain and reliability Roger. Keep up the good work. If there is anything you think I can contribute, do let me know and I’m more than happy to contribute back to the community.
Frank Sheeran ·
My recollection from the old Canon book Lens Work, which had all their MTFs, is that the primes are all perfect anyway, from corner to corner. If anything is needed to be tested, it’d be the alternatives: latest 70-200 with 1.4x and 2.0x, 200-400 with built-in TC, etc. Personally I use 70-200 with TC then step up to 600/4. If I have light for 400/5.6 I can shoot 600/4 and vice versa. If the shot’s good people will rave about it, but no-one simply compliments me on a sharp boring shot. (Unlike the 135/2, where people DO.) With 600 prime the question isn’t the lens, but things like, do you use two tripods, atmospheric conditions such as heat ripples or dust in the air, and so on.
And while I’d like to see the primes with TCs, it’s basically, what choice do I have. I’m simply not going to buy a 800/5.6 if I have a 600/4, no matter how much sharper it is. In contrast, people DO legitimately have to decide between the 50/1.2 and 1.4, or 135/2 vs. 70-200, or 24-70 vs. 24-105/4IS, so those MTFs are really useful.
Roger Cicala ·
Frank, a good question and one I’ll try to answer here. I’d also suggest asking Klaus to do the same. Optical Limits is, in my opinion, the best and most consistent of the Imatest review sites. They also do a very thorough job of analyzing distortion, vignetting, and presenting stopped down data, which I don’t.
So, to your point, the differences are as follows.
We’re testing at infinity using an optical bench; no camera. They test at closer distances (varies with focal lengths but maybe 5-6 feet on a wide angle, 30 feet on a telephoto) using a camera.
The MTF bench gives a lot more data and presents it as curves. Imatest gives a subset of data, usually the MTF50. One nice thing is you can estimate the MTF50 at different frequencies from the MTF graph, but not to the degree they measure it. In the graph below, the yellow dots are basically the MT50 at center, mid, and corner.
https://uploads.disquscdn.com/images/7d40dbd72c170577638ad5ae4ba4e4c56301ef490d7a5e25d83edcd85acaa9e1.png https://uploads.disquscdn.com/images/7d40dbd72c170577638ad5ae4ba4e4c56301ef490d7a5e25d83edcd85acaa9e1.png
In a well-controlled Imatest setup like optical limits has, you can make some comparisons between what the lens alone looks like at infinity, and what the lens-on-camera looks like close up. Some lenses do better closer, some worse, most not too different. Some cameras apply in-camera sharpening and corrections (OpticalLimits.com turns everything off they can, but in a few cases, not Canon that we know off, there’s some correction applied to the RAW files.)
And finally, as you point out, it’s easier to read 3 or 4 points than 80 points.
Roger
Claudia Muster ·
And, most important: Opticallimits measures exactly one lens, and nobody knows whether it’s an average, an exeptionally good or an extremely bad copy. Lensrentals averages a 10 copy set and often (albeit unfortunately not always) also shows the variation.
Roger Cicala ·
Claudia, I’m in a conundrum about the variation. I still consider it a beta tool, results that are very suggestive but should be taken with a grain of salt. However, people abuse the hell out of it online. It also has a weakness: if nearly all of a given lens have a soft corner, the variance doesn’t look bad since each copy looks the same. So I’m undecided with what to do with those graphs.
Brandon always suggested Monte Carlo charts were the most appropriate way to show that data. I argued that hardly anyone understood Monte Carlo charts. These days I’m thinking that’s a strong plus for using them.
Donga ·
Between 85mm f/1.8 and 100mm f/2, do we notice these MTF chart differences in real use? I have 100mm f/2. I like this focal length over 85mm. I have 50mm stm lens. 85mm is too close. I do not have 135mm. I am using 100mm for portraits.
Roger Cicala ·
To be honest, with the 85m f1.8 and 100mm f/2, the sample variation is large, so given one copy of each, I’d hesitate to guess which would be sharper. Remember also the 100 is being tested at a slightly smaller aperture, which helps it a bit.
G Dan Mitchell ·
Just want to say “thank you” for this and the other similar work you share.
Dan
GDM ·
Just want to say "thank you" for this and the other similar work you share.
Dan
Jeff Allen ·
Interesting set of results. We use a Ealing MTF bench with modified software for our use, we also have a Zeiss MTF bench which is little used. We test all lenses separately to the camera, test the camera & then the lenses on the camera for Cinematography use. We project lenses also on projectors we have made in-house (commercially available ones differed too much and we have projectors in multiple offices). We also have a f-stop / t-stop measuring machine. We also have a machine for measuring the actual image circle.
The crews will shoot charts, harp tests, infinity walls. The French will shoot graph paper but in the end it comes down to the subject, lighting and the user.
Roger Cicala ·
HI Jeff. I’m not familiar with the Ealing, but I feel you on the Zeiss bench. State of the art back in the day, but very limited in what it can do. Interesting what you said about projectors. We have a couple of Croziel’s in the closet we don’t use anymore; just weren’t sensitive enough – photo shooters (and admittedly probably pixel-peepers) could see issues on high resolution cameras that the projectors weren’t showing. Knowing 8k was coming, we moved the video lens testing over to the bench, too, but it may have been about the projectors / reticles we were using.
FWIW I’ll be doing the Cinema Primes we carry this way in a few weeks.
Glenn Ruhl ·
Any chance of testing APS-C lenses?
Roger Cicala ·
It’s lower on the priority list. Not a lot of rental demand so we don’t have lots of copies like we do with the FF lenses.
Russ Wright ·
Would love to see some of the better FujiX lenses tested. 23 1.4, 56 1.2, 16-55 2.8
Roger Cicala ·
Would love for my Fuji bench mount to get finished so I can do that.
Frank Sheeran ·
A big problem with all the MTFs I see is that they’re telling you what will happen to objects on the periphery when you focus in the center. If the focal plane isn’t flat, then such lenses give a horrible MTF.
Maybe I’m insane, but if I have a subject on the periphery, maybe… I focus on that subject, instead of some hypothetical object in the center of the frame??
What I’m deciding I really want to see is an MTF that instead refocuses at 3mm, 6mm, 9mm, 12mm, 18mm, 21mm, as needed for a lens, and that can tell me what resolution a lens will give me on that peripheral subject.
Basically, the “MTF wars” with the standard chart rewards vendors to give flatter focal planes, instead of sharper (if refocused), less astigmatic, or smaller lenses.
(And we can’t just look at a regular MTF and note that tan and sag curves match and conclude, OK, curved field but not astigmatic. Because it could be that it curves one way for tan and the other for sag.)
Then, graphs of the actual field curvature.
And finally, I don’t really see this often but it sounds trivial, but just a grid of defocused white dots on black, like 11×7 grid or something, to get a feeling for bokeh. Shoot it so the bokeh balls are mid-value so we can see any rippling, bright edges, etc.
Roger Cicala ·
You mean like this: https://www.lensrentals.com/blog/2017/11/testing-lenses-best-individual-focus-mtf-curves/
🙂
Frank Sheeran ·
Yup! Great minds think alike!
Even then I think you’re short-selling your Best Focus charts a bit: “the graph isn’t reality. If you did focus at, say 16mm away from the center, the rest of the image wouldn’t be as sharp as the graph says.” Right, but if you’re focusing 16mm away from center, it’s because that’s where your subject is; if you CARED about the focus in the center of the frame you’d be focusing there instead. Now granted, often you DO have multiple subjects left to right that have to be sharp, but the field curvature graph I suggest would tell you which lens to choose for that shot. (15-35@35? 24-70@35? 35/1.4? 35/2?)
(BTW, I can’t think of the term: when we have the “plane” of perfect focus in front of the camera but it’s not a plane, it’s an undulating curtain, what do you call that? “plane of focus?” “focal plane?” I get the impression a lot of the literature talks of this effect by starting with a flat wall in front of the lens then discussing the undulating shape of best focus around the film/sensor, but to me it seems more useful to hold the sensor flat–because it is–and instead describe the distance at which things are in focus.)
Roger Cicala ·
Field of focus. We also do a lot of 3-D stuff to measure the field of focus.
https://www.lensrentals.com/blog/2016/09/fun-with-field-of-focus-part-1/
https://www.lensrentals.com/blog/2016/11/fun-with-field-of-focus-ii-copy-to-copy-variation-and-lens-testing/
Especially the most fun part: there’s a lot of copy-to-copy variation in the field of focus, particularly with zooms.
Frank Sheeran ·
Field of focus–thx!
Copy-to-copy variation–man I envy the unique position you guys are in to analyze that.
24-70mm f2.8 Mk II–very very interesting! Would not have guessed. Do you have any knowledge or guess as to why? It’s a complicated lens and it straddles the wide and tele sides which might make it optically more finicky than wide-only and tele-only, and it has big glass for the big aperture, but that’s true of everyone else’s middle pro zoom too. I’d be curious to hear if the RF 28-70/2.0’s are worse yet.
(As long as we’re talking I’m curious to see 50/2 APO-Summicron vs. RF 50/1.2 vs. Otus; no other site seems to have tested even two of the three but all claim the one they’ve tested is the last word.)
Roger Cicala ·
I think it’s a choice on Canon’s part: we’ll allow adjustment optically to change the field if it improves resolution. Sigma and Nikon 24-70s don’t really do that.
Professional Photographer ·
What about the 400mm primes? I’m interested in the II vs III head to head.
Roger Cicala ·
The exceed the benches size capacity. We’ve done some limited testing on them but I’m not posting them since technically they are out of spec.
Baconator ·
Roger, what about 200/2 and 300/2.8 II? Thanks!
Roger Cicala ·
The 200 fits and 300 is close, but I don’t have 10 copies done of either. In this case not that we don’t have enough, but simply that vibration affects them so much it’s very time consuming to do them.
Baconator ·
Well, maybe some day then… 🙂 I bet lots of folks would be curious to see how $5k+ lenses perform.
Bastian Kratzke ·
I think in another post I have already seen charts for the 2/200 L IS.
Are those graphs not up to the current standard?
Renaud Saada ·
Roger, thanks a lot for these.
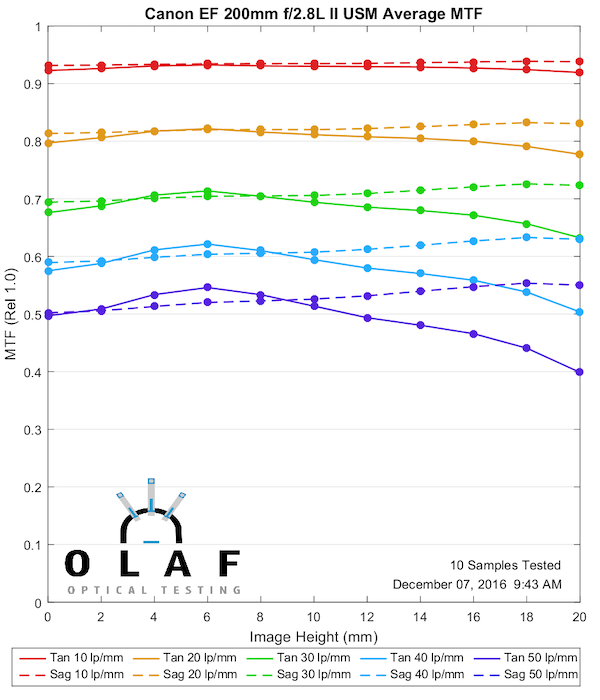
Is the 2.8/200 LII too long to be in the list and will it be in another post with “very” long focal lenses?
Roger Cicala ·
It’s not too long, and we’ve already tested it, I just forgot about it. I put it put up.
Renaud Saada ·
Thanks a lot.
Joe Adams ·
Thanks for the good work Roger! Are the RF Lenses going to be added here?
Roger Cicala ·
No, they’ll be a separate post, but it’s months away. We still don’t have a mount engineered yet.
Joe Adams ·
Thanks!
Mikhail Rusin ·
Nice work Roger!
May I advise you to add confidence intervals to your graphs? This would allow us to see sample variation for each lens
DrJon ·
BTW (as I was looking for an MTF on the 200/2) the 200/2.8-II plot is titled “Canon 200mm f2.0L II”, which I assume will never exist in EF…
Dimy ·
When making MTF graphs i never understood why they often start at 10lp/mm. IMHO the graph shall start with min.30lp/mm and go up to 60lp/mm in 10 increments.
Dimy ·
Did you check if the entrance pupil, therefore the aperture, of the macro lens changed?
Also, from my experience, a MTF chart should actually be reported with the spectrum chart of visible light used.
I experienced myself how easy it is to alter any MTF diagram to the better simply by intruducing a filter.
This is a minefield for all MTF graphs shown from all companies over the world that should be rid of.