Please Note: This is a Geek Level 3 Article. It has no useful information about photography or videography. If you’re a lens geek, though, it’s kind of cool. And it will serve as our background and methods for upcoming articles.
Well … How did I get here? David Byrne
One of the nice things that happens at Olaf Optical a lot is we wander off on tangents. Way back when, we found ourselves (much to my dismay) testing filters. When we started testing filters, Brandon began to Speaking in Tongues (his tongues being physics and math) about how we could set up a spectroscopy lab for just a few thousand dollars. So we did that, and it was pretty cool.
But then we thought, hey, it would be even cooler to measure the spectra of various lenses, too. We knew measuring the transmission spectra of a lens, with multiple elements bending light, was a lot more difficult than measuring transmission spectra through a flat plate of glass. But it was Winter, which is slow around here, and we were bored, so we thought we’d give it a try. (The alternative theory is that we were happy and content, and uncomfortable feeling that way, so we decided to do something nearly impossible.)
Brandon, speaking in more tongues, thought we could add a couple of widgets to our flat plate spectrometer and would be able to test lenses. Brandon was wrong less correct than we had hoped. By the time he had figured that out, well, we were going to do this no matter how many innocent people died in the process and how much of other people’s money we spent. Months later, having replaced light sources, collimators, integrating spheres, and hardware, we began to get results.
How Do I Work This?
The (somewhat) standard way of measuring lens spectra is with a Monochromator. This sends a specific wavelength of light through the lens and measures the transmission; then you change the wavelength and measure it again about 2.2 bazillion times. This gives you absolute transmission at various frequencies and is the gold standard.
But monochromator spectrometers are either breathtakingly expensive, very slow, or both. We test hundreds of lenses a day; very slow is useless to us. A transmission spectrogram is very fast; a few seconds per lens after calibration, but gives relative, not absolute, results. In other words, it doesn’t say ‘this lens passed 97% of the light at 540nm wavelength. It says ‘this lens passes the most light at a 654nm wavelength, and at 540nm it passes 94% as much light as it does at 654nm’. That works fine for our purposes; there are other ways we can measure absolute transmission.
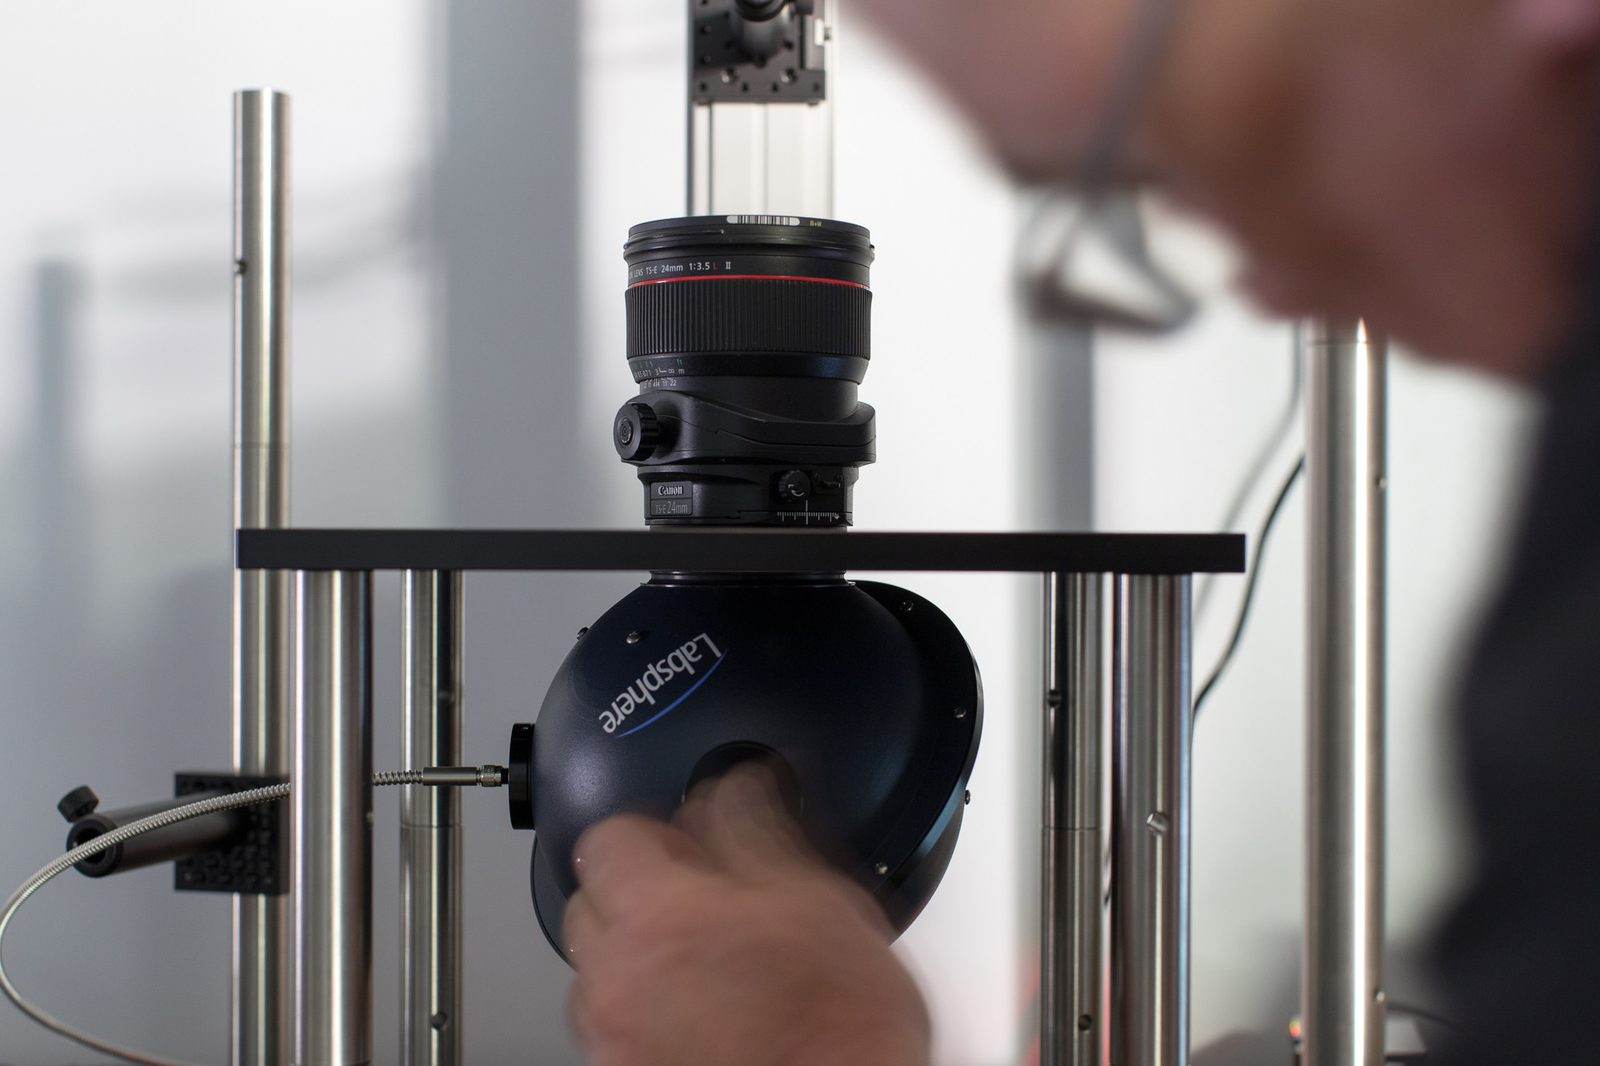
Our method is, in theory, very simple. A strong light source passes through spectral flattening and diffusing filters, is collimated, and then shines into an integrating sphere attached to a spectrometer.
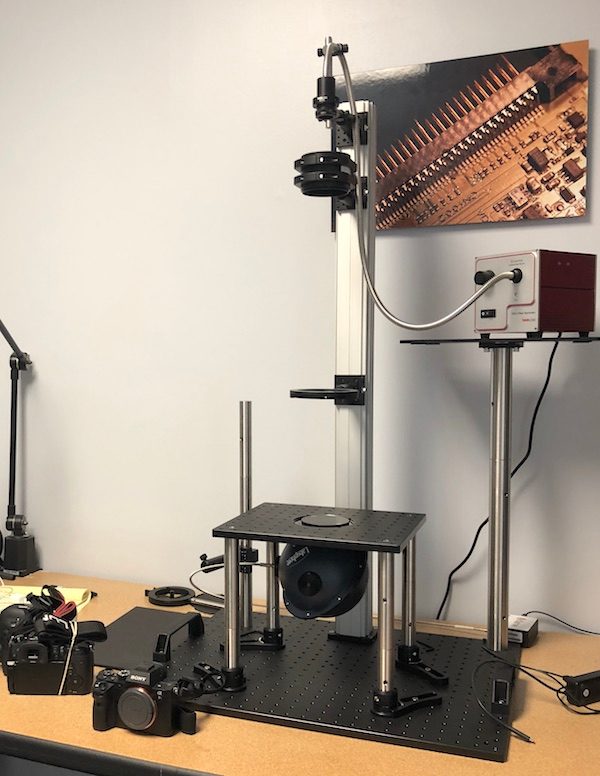
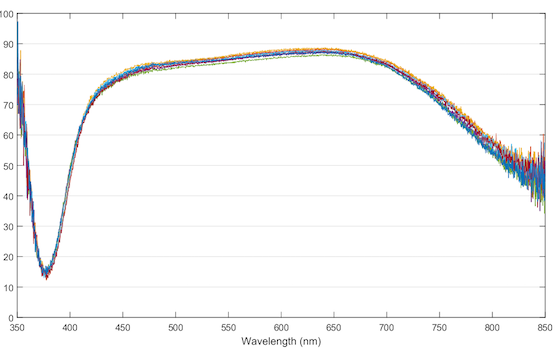
After the aperture of the beam is adjusted to the proper size for the lens being tested, the system is light and dark calibrated, a lens placed in the beam and the transmission spectrum mapped out like the graph below.
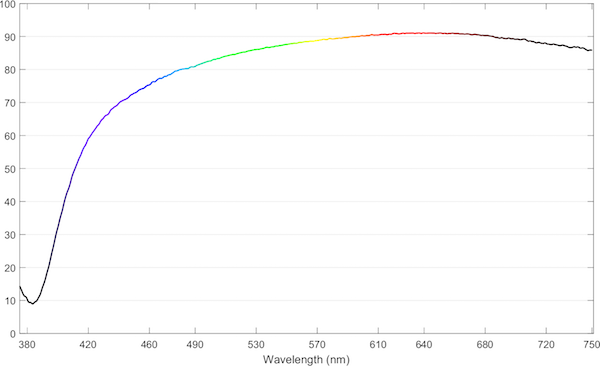
The lens above would have a rather warm cast since it transmits red light much better than green or blue. (You’re welcome for the nice graphing program showing you what color is where, courtesy of Markus Rothacker. Notice that the graph turns black outside of the visible range, both UV, and IR.)
Is our method perfect? No, not at all. We have to change integrating spheres to different sizes when we get down to smaller aperture lenses. At very small apertures we’re screening out so much light that we have to increase the gain on the spectrometer to the point where noise becomes an issue, especially in the red spectrum. Eventually, the aperture can get so small (a 15mm f/3.5 for example) that we just can’t get enough light through the system to test effectively, at least not unless we get a nuclear fusion light source or something.
And as I mentioned above, this doesn’t give absolute transmission numbers; they are relative. We can compare various 35mm f/1.4 lenses and say with accuracy this one lets a little more light through than that one. But we can’t directly compare a 35mm f/1.4 with an 85mm f/1.4; the apertures are different sizes, so the amount of light entering the integrating sphere is different.
But is it fast? Oh, hell yes. Once it is set up for a given lens (85mm T1.5, for example), we can run spectra about as fast as we can change lenses. At small apertures, when we have less light, it may take 10 or 15 seconds per lens, which is still fast.
Am I Right? Am I Wrong?
So we had a technique that makes pretty graphs that look cool, but we still didn’t know if it is was test-worthy. To start evaluating that we’d take a single lens, test it, undo the testing set up, set it back up, retest it, etc. If the technique was reproducible, we should get the same results every time, and we did.
Then we checked multiple copies of reputable lenses to see if they were the same. Again, that worked well.
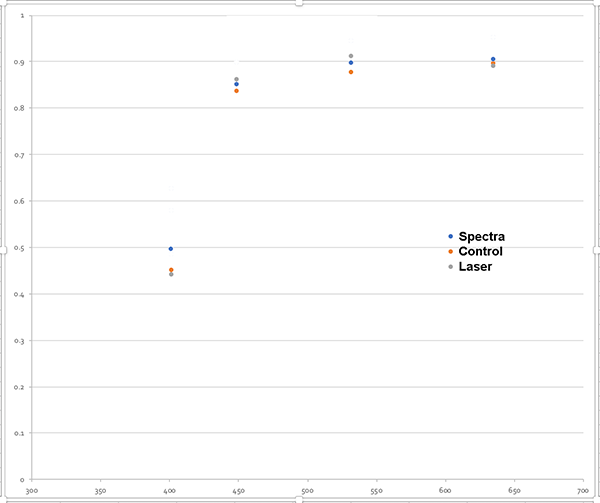
The results were reproducible and consistent, but we had to see if they were also accurate. Sigma Photo was kind enough to share their in-house spectrometry data, allowing us to compare our results with theirs. We also had our laser transmission set-up which does absolute transmission measurements, although only at four discrete wavelengths. So, we compared our spectrograms to Sigma’s spectrograms and our laser transmission data.
This let us know where we matched up well and where we seemed to have issues. To make a long story short, we found at extreme apertures our system gave slightly different results at first, which is what led to different sizes integrating spheres, changes in light sources and filters, etc. When the dust settled (and I’m talking several months of settling), we were able to accurately test spectra in lenses with aperture diameters of just under 1 cm (a 24mm f/2.8, for example) to about 7 cm (85mm f/1.2 or 135mm f/1.8) with good accuracy and reproducibility.
Into the Blue Again, After the Money’s Gone
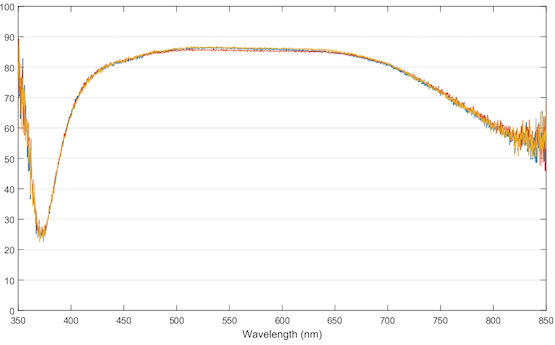
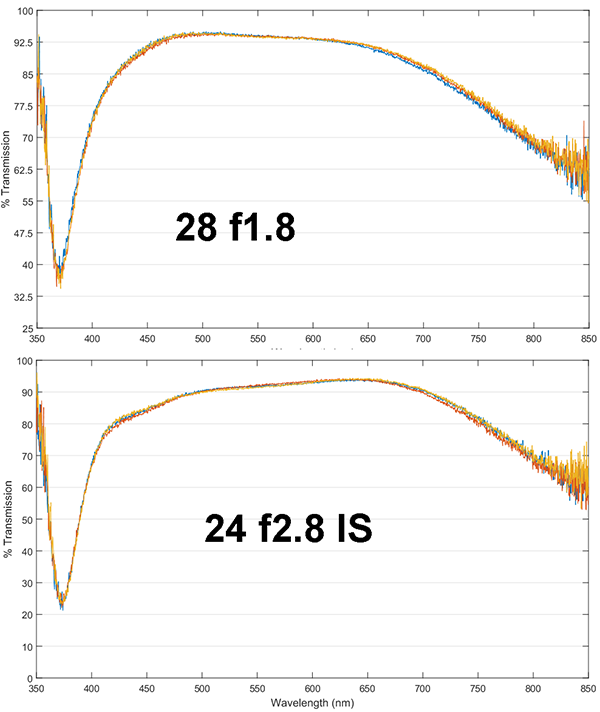
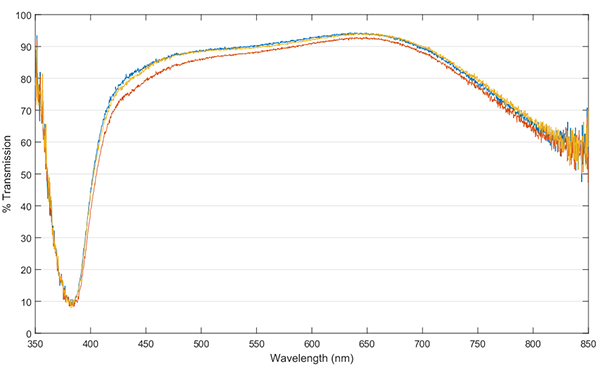
Finally, having spent all our money and done lots of calibrating, we came to the ‘but can you see it’ phase of testing. If our spectra were really showing a significant difference, then we should be able to predict results that could be seen by imaging. For example, below are the spectra for multiple copies of the Canon 24mm f/2.8 IS lens and the Canon 28mm f/1.8 lens. The 28mm is a much older design and has a cooler tint (transmission is greatest at the blue end of the spectrum) than the 24mm f/2.8 lens, which has the highest transmission at the red end of the spectrum.
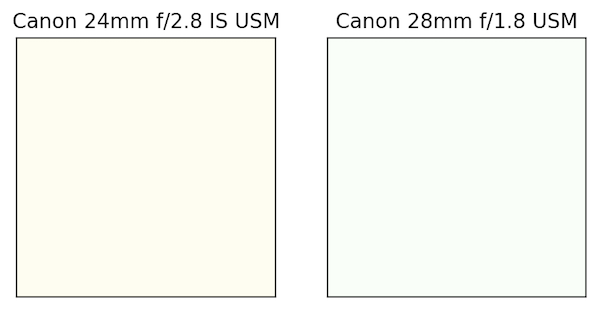
If we turned off a camera’s white balance and took pictures of a whiteboard we should see a slight difference in the tint of the images, and that’s precisely what happens. (Well, we’re assuming some reasonable monitor calibration, too, but you should be able to tell the 24mm has a slightly orange tint, while the 28mm is rather blue-green.)
Of course, if you white balance before you shoot, they’d be identical. Probably. And for those of you thinking ‘well, you could have just taken the pictures to start with,’ where’s the fun in that?
The second confirmation we got was somewhat accidental, but let us test our main reason for doing this — to be able to rapidly check if a lens’ coatings were altered in some way. We were asked to optically test a lens that seemed to have slightly low contrast. Our regular tests showed it was just a little less sharp than it should be, but there was no sign of any decentering or optical issues. It was puzzling.
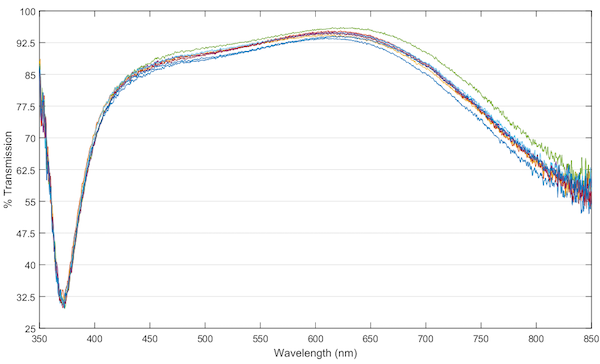
When we did spectrometry comparing it to other copies of the same lens, it was apparent that this lens (red graph below) had slightly lower transmission, particularly in the yellow to blue wavelengths.
Further investigation showed that the second element had a different reflective color; it was inadequately or incorrectly coated. (It was nearly new, so it seems unlikely that the coating had deteriorated.) While most of you probably think that’s a stupid thing to test for, the photographer who owned this lens didn’t.
And remember, we handle thousands of lenses. Sometimes coatings wear down on front elements (or scammy resellers remove the coating when buffing off scratches – yes it happens; usually on very expensive lenses). Exposure to certain fumes can ruin coatings, too. Resin or glue between elements can deteriorate and fog over time. This gives us a way to detect these problems quickly, accurately, and efficiently.
Where Does This Highway Go To?
Detecting lenses with coating damage is the main reason we’re doing this, but there are some fun things that we can do, too. We can compare different lenses and look at their color cast. Everyone knows some have slightly warmer looks, while others are cooler. Many people claim a certain brand has this look or that. Yet for the Canon lenses above, a certain brand of lens doesn’t imply a particular color cast; those two were quite different. We’ll put out some articles soon showing spectra for multiple lenses from each brand.
There are other esoteric questions we want to answer. For most lenses we’ve tested, there is almost no copy-to-copy variation in lens spectra. There are a few lenses, however, where things do seem a little more variable. Usually, that’s just a minor difference in transmission, like the one below. But we have found a few where coatings in different copies have a different spectral curve, not just a bit more or less transmission.
Cinema lenses are generally color matched, but there’s some variation there too. And when a company makes both Cine and photo version of a lens, are the spectra the same, or different? (The answer is yes, BTW, depending on the company.)
In the next couple of articles, we’ll show you a lot more spectra and a few interesting and sort of surprising things we’ve found. It probably won’t change how you create images at all. But, for some of you, it will be fun to see.
Roger Cicala, Brandon Dube, and Aaron Closz
Lensrentals.com
April, 2018
The authors wish to express their thanks to Sigma-Photo Corporation, especially Kazuto Yamaki and Jumpei Nakamoto, for their invaluable input, which speeded our calibration process by many weeks.

72 Comments
hywelphillips ·
Your articles are awesome and make me kinda wish I was still earning my living as a scientist instead of a photographer. Thanks, guys!
Roger Cicala ·
Well, I can’t say we’re earning a living with this stuff, but it is really fun.
Dave Hachey ·
You make a living as a photographer? I gave up my academic ‘day job’ a couple of years ago so I could play photographer, but I had some serious toys in the lab that kept me entertained. Cheers…
Andre Yew ·
Awesome project guys! Have you guys measured Zeiss Milvus lenses whose optical formula haven’t changed from the Classic line to see if the change in coatings affects color?
Also have you seen any dependence on focal length for spectral transmission?
Roger Cicala ·
Yes. And yes. More articles are coming 🙂
Munchma Quchi ·
But what is the sharpest lens and f-stop? Sheeeeezz……
KWNJr ·
I hope you have enough time to do all you want to, and keep up with your reading public?
Claudia Muster ·
Great article, as always. Just one nitpick: You cannot compensate different spectra by adjusting the white balance. You can compensate the colour cast of a white board, but not the individual colours. (If that’s visible in a real life picture is a different question, of course.)
Roger Cicala ·
Very true, Claudia, and thank you for bringing it up here. I was too chicken. 🙂
TomH ·
Thanks for sharing all this info you’re collecting! You are answering some questions I’ve long wondered about.
One minor nitpick: The device is a monochromator, not a monochrometer, since it’s producing and not measuring something. I’ve made the same mistake before as well.
Roger Cicala ·
Thank you, Tom. I’ll fix that. If that’s the worst typo of the post, I’m doing better than usual!
geekyrocketguy ·
“This is a Geek Level 3 Article. It has no useful information about photography or videography.”
I have an application of this!
Is the sharp falloff from 350nm to 370nm in all these plots real? Do you know what causes that?
I do a lot of night photography of the operations of the telescopes atop Mauna Kea (https://www.flickr.com/photos/geekyrocketguy/albums/72157648786888099). One of the telescopes will be commissioning a UV (350nm) laser for its adaptive optics system this summer. The PI of the instrument would like photos of the laser propagating off into the night sky. The problem isn’t camera bodies (a full-spectrum-modified body is sensitive to this wavelength), but the lenses. The PI says the only lens he’s found that transmits UV adequately is an old Nikon 60mm f/2.8. However, these plots suggest otherwise.
Do you have recommendations for a lens that is wider than 60mm, f/2.8 or faster, has decent corner sharpness, and transmits 350nm well? Or is the PI wrong and most lenses are pretty decent at 350nm, but crappy at 370nm?
David Bateman ·
Excellent!, I have been thinking about doing something like this for the last couple years. I hope your not using a star analyser grading as it absorbs hard at 380nm. There are other cheap 1000 line sheets which go further into uv.
See:
http://www.ultravioletphotography.com/content/index.php/topic/1601-simple-spectrometer-for-filter-test/page__p__10412#entry10412
http://www.ultravioletphotography.com/content/index.php/topic/2643-first-attempt-with-linear-filter-grating/
What has held me up was good software to get your final plots that you presented.
What are you using?
VSpec seems ok and is freeware
http://astrosurf.com/vdesnoux
Brandon Dube ·
You can use raynbow to do plotting in python. Here’s an example — https://uploads.disquscdn.com/images/3d97d2c300558769b1f460f2165caa168aef6c7bf56014e0e8ce8990a56fdc33.png
It takes only 2 lines of code to make the image. You would would need your own parser for whatever data you have to work with. It would be nice if you could contribute that to raynbow and add to humanity’s collective toolbox.
We use an Ocean Optics Flame spectrometer. The internals are their problem. Some people say they have stray light problems under 400nm or so, which would be where or bias vs the reference comes from at 405nm.
The swatches here are actually generated by raynbow, fwiw.
Ilya Zakharevich ·
If I would program the plotting, I would “draw transparent” over a white background (so the the graph?—?which is a narrow band?—?is transparent), and would just overlay on top of proper color gradient. (For last few years, I prefer plotting in vector graphics, not in pixelated formats.)
bat flag ·
Could this method shed light on the relative merits of lenses for use on infrared-converted cameras?
Roger Cicala ·
In theory it can show better near IR transmission compared to other same focal length lenses. But it wouldn’t help find which ones flare in IR.
Petrochemist ·
Not a huge amount of use for infrared lenses as most lenses will transmit significant NIR up to ~1100nm (which is the limit visible to converted cameras).
Spectrometer results won’t give any indication of hot-spots, or how achromatic the lens is moving into the NIR
Spectral transmission is of some use for the other end of the spectrum for shooting UV, (at least if done on suitable spectrometers – The Lens Rentals spectrometer clearly doesn’t work for UV).
Having access to a good quality UV/Vis spectrometer at work I’ve measured a few of my lenses, and found a limited set that transmit significantly more UV – most transmit nothing below 350nm.
My results have been without the benefit on an integrating sphere – so are somewhat unreliable for wide angle lenses (if alignment is not perfect most of the light beam misses the detector), but I believe my results are reasonable for standard & long focal lengths. For these I typically see 90+% transmission from 450nm to over 900nm frequently getting slightly more transmission in the near infrared than in the visible. A few of the more modern lenses have shown a steady dip in transmission moving into the NIR – presumably from the lens coatings. Note due to interest in UV imaging most of the lenses I’ve studied have been older legacy lenses – the average age could well be over 40 years, which may skew the results in IR.
Dave Hachey ·
Thank God someone has finally done this. There’s so much ambiguous information and anecdotal stories out there as to be completely useless. Some tales are quite real though, like the yellowed resin due to radiation damage from thorium oxide lenses. Do you have a sense yet as to what causes the greatest color shifts. AR coatings, lens glass or resins?
Brandon Dube ·
By far the biggest cause of color shifts is coatings. A modern lens has, say, 16 elements in 10 groups => 20 air to glass interfaces. 4% reflection each gives you 0.96^20 = 44% transmission. The coatings are responsible for bringing that up to a uniform ~90%. If they don’t do it in a way that is spectrally uniform, you get color shifts.
Dave Hachey ·
That’s what I suspected too. After all, the AR coatings behave like dichroic filters to some degree.
Dave Hachey ·
“Geek Level 3”? Not really, you don’t show any math… I really like your approach to these topics, educate and entertain.
kbb ·
It will be interesting to see if the measurements comport with by-eye assessments. Example: In looking through a camera lens at a neutral white surface illuminated with daylight, the typical modern Zeiss ZF/ZE lens often appears to the eye to have a distinctly warmer (more orange) color transmission compared to a modern Nikon or Canon lens. Illusion, or real?
Someone ·
Can I suggest that you use the same vertical axis scale (0-100%) in all the plots to make them more easily compared?
Roger Cicala ·
YEp! The software defaults to crop the area – I need to watch for that going forward.
Nick Choroshyliw ·
I guess I’m one of those geeky guys who really appreciates this type of experiment / test. I actually use and x-rite color checker (white balance and color) when shooting in the studio. Over the years I discovered that with the same camera, and fixed light output the white balance changes when I use different lenses. Thank you!
Emmett ·
Thanks for the article and the information. I am just wondering what those wavelength inconsistencies show above 700 nm? is it showing an issue in the spectrometer’s dynamic range?
Just a thought; I wonder If you measure a lens transmission characteristic relative to a standard glass would probably cancel out detector’s day to day variations, since the absolute data are kind of not normalised and they may not be accurate for comparison purposes.
Brandon Dube ·
I think “wavelength inconsistencies” is a harsh way of saying noise. But yes, they are a limitation of the spectrometer’s DR / the spectral uniformity of the source. The same goes under 400nm.
There is no need to do any sort of daily calibration. This is an inherently relative measurement, and drift of the source and spectrometer over time self-cancel between the reference and unit under test measurements.
Emmett ·
Sorry I should have used a more appropriate word, I think linearity is a better word to use of why detector response looks inconsistent at 360750 (nm) . Hopefully the interface software self checks for detector’s stability and linearity, because those can be some of the major sources of error including room temperature fluctuations. I really enjoy to see that some people are doing a fundamental job here. Thanks for sharing.
Brandon Dube ·
It’s just noise. Modern CCD and CMOS is very linear.
Peak around 570nm of ~58,000 counts. At 400nm the value is more like 500 counts and is exponentially falling at smaller wavelengths. The same is true above 700nm. The reference signal is weak below 400nm and above 700nm.
Division of small numbers is just a noisy process.
Dr Klaus Schmitt ·
I have made my comment befre I saw this. Your lightsource is the problem, not delivering enough intensity assuming that your collimator is for visibly light only, another issue. Is your OO spectrometer of the UV-VIS type?
Brandon Dube ·
There are two problems; one is indeed the source. When you find an affordable source that has uniform output from ~300nm to ~800nm, let me know. As far as I am aware, they do not exist.
Our spectrometer is made for 250-850nm or thereabouts, I don’t remember the exact cutoff in IR.
Dr Klaus Schmitt ·
I use a stabilized Hamamatsu Xenon source with a special Xenon 200 Watt bulb, which reaches down to 180nm, but in practise only about 300nm can be safely reached doe to the used fibers etc. Be aware that you need a suitable collimator, too. I use an apochomatic UV-VIS one, which was a nightmare to find…unfortunately no longer made.
I also have the stabilized Ocean Optics DH-2000 BAL, but the intensity was too low to be useful to measure lenses using an integration sphere (with the inherent massive light loss)
Roger Cicala ·
Dr. Schmitt, that seems like a good solution, but this trial was basically a feasibility study for low cost, rapid testing in visible light. Our collimator, light source, and fiber are all visible light. There is there is some bleed into near IR and near UV that may or may not be useful at all, but we can’t justify the cost of a true UV setup.
We may, if we decide we have a need to test smaller apertures, look at a more powerful source (we’re using 150w halogen now) and then we might revisit it, but our current interest is largely solved by testing absolute apertures of 1cm and larger.
Dr Klaus Schmitt ·
OK, I would reduce the display results to the valid visible part then, say 400-750nm.
Roger Cicala ·
It’s still a work in progress, of course. At this moment I’m leaning toward perhaps graying the 750 known values, I probably will cut that range out.
Expecting something like this, our graphing widgets actually pop up and ask us what range we want to plot for each lens. It led to one bad graph above, but that was the reason; I wasn’t sure what values we would eventually settle on.
Dr Klaus Schmitt ·
Well, I would at least remove or cut off that part on left side (short wavelengths) where the transmission goes virtually upo again, as this makes no sense at all based on physics… 😉
Brandon Dube ·
Dr. Schmitt,
Our collimators are made of UV-grade fused silica and do not meaningfully attenuate the UV.
Xenon lamps are IMO unsuitable for spectroscopy, as they have many sharp peaks which you must either overexpose (now your data is full of holes) or properly expose (the bulk of the spectrum has low signal and high noise).
Or you can spend (probably tens of) thousands buying narrowband filters to equalize the peaks to the bulk signal.
Dr Klaus Schmitt ·
That Xenon light is indeed specially filtered, forgot to mention this 😉
Brandon Dube ·
Well, there goes the affordable part. A Xenon source is already > $6,000 by itself; add several thousand for specialized filters to make its response uniform, and suddenly it costs more than this entire setup.
x3872 ·
I may be wrong, but I suppose your transmission data below wavelengths of maybe <390 nm cannot be correct; eco-friendly, non-leaded, high refractive index glass (look at e.g. Schott or Ohara data sheets) used in modern Canon lenses etc. absorb strongly at wavelengths <400 nm. The Ocean Optics Flame contains a single holographic or ruled diffraction grating, which in your case I suppose is designed for a wavelength range between 250 and 800 nm. I suppose you also have no short-pass or long-pass filter. So the entire optical spectrum between the IR and UV enter into your device simultaneously; your spectrograph must then efficiently resolve the UV light (less than 100), then probably the counts measured at 390 nm can consist mostly of stray light.
Brandon Dube ·
You have restated a combination of my comments
x3872 ·
Sources: G.Zonios et al., “Noise and stray light characterization of a compact CCD spectrophotometer used in biomedical applications” in Applied Optics 49, 163 (2010) characterizes the Ocean Optics model USB2000 (which I suppose has a similar design as your Ocean Optics Flame). Figure 7 shows how the stray light when a tungsten-halogen lamp is observed with the spectrometer increases exponentially at wavelengths shorter than 400 nm. At 350 nm for example, they report that 20% of the counts can be fake (i.e., photons of visible wavelength pretending to be UV photons). I suppose at minimum, a short-pass filter (Schott glass UG5 or BG3?) should be used to reject visible wavelengths.
Er ·
I should have used a more appropriate word, I think linearity is a better word to use of why detector response looks inconsistent at 360< and >750 (nm) . Hopefully the interface software self checks for detector's stability and linearity, because those can be some of the major sources of error including room temperature fluctuations. I really enjoy to see that some people are doing a fundamental job here. Thanks for sharing.
Emmett ·
I wonder if there is any way I can contact you by email?
Brandon Dube ·
brandondube@gmail.com
Er ·
Thanks for the article and the information. I am just wondering what those wavelength inconsistencies show above 700 nm? is it showing an issue in the spectrometer's dynamic range?
Just a thought; I wonder If you measure a lens transmission characteristic relative to a standard glass would probably cancel out detector's day to day variations, since the absolute data are kind of not normalised and they may not be accurate for comparison purposes.
bdbender4 ·
It’s the same as it ever was
Roger Cicala ·
Thank you!
Greg Dunn ·
Well, some of us only get to geek out on lyrics once in a lifetime.
geekyrocketguy ·
I posted a question here a couple days ago, and it seems to have been deleted for “spam,” which it is not. Maybe you could re-enable the comment or, more importantly, answer my question? Thank you!
https://uploads.disquscdn.com/images/2208bdac82d6cc9bda429b6c53933d714e727328434575432767fdecc741fcdf.png
Roger Cicala ·
Hi Geeky,
I have no idea why that happened; I’m traveling and working off of a tablet, but when I get home I’ll try to find out.
My incomplete answer is I believe it is to some degree, but I have some concerns about how real. We’ve concentrated on visible light, knowing our light source / filter system has less light in IR and UV for certain. The Ocean View Spectrometer we’re using has some questions about accuracy under 400nm and at both extremes there’s more noise magnifying the signal. But our outside data does confirm a very similar drop in this area for at least the lenses we have outside data for (which isn’t many).
I’m glad you brought this up; we have access to a couple of coastal optics UV-VIS-IR 60mm lens and I’m going to run those and hopefully get the transmission data from Brian Caldwell, who designed it and is a friend.
I wouldn’t be surprised at what the PI found being accurate, though, that older lenses might have better UV transmission. I’m not at a point of making any suggestions yet, but I’ll look into this. Brandon will probably be along with a more complete and informative answer soon, too.
Brandon Dube ·
Hey,
I’d love if you could email me at brandondube@gmail.com — I think I know someone who has worked with you!
Most lenses do have pretty bad transmission at UV wavelengths; glass, as a material, has an absorption band in UV. You can see that on most materials at refractiveindex.info, e.g. BAK10 here — https://refractiveindex.info/?shelf=glass&book=BAF10&page=SCHOTT
When you put (say) 16 elements of glass in front of the sensor, you get the product of all these curves, more or less. The result is very low transmission under about 400nm.
There are special materials, e.g UV-grade fused silica and Calcium Fluorite that are transmissive at these wavelengths, but they also require special coatings. According to Jenoptik, the 60mm f/4 has about 60% transmission at your needed wavelength. Most other lenses will have effectively zero (you can ignore our high numbers there, they are just a byproduct of dividing two almost zero signals).
Jenoptik data (download specsheet) — https://www.jenoptik-inc.com/product/uv-vis-105mm-slr-uv-vis-ir-60mm-apo-macro-lenses/
KWNJr ·
Did anyone make an all “reflective” lens for the broadest spectral use? Some telescopes perhaps??
John Dowdy ·
It is very unlikely you could do better than the Coastal Optics UV-VIS-IR 60mm, which you can rent from Rodger.
At 350-370nm there is less need for a specialist UV lens as select older lenses may suffice. If you fine need of a wider angle you may wish to consult this reference:
http://www.ultravioletphotography.com/content/index.php/topic/1654-sticky-uv-capable-lenses/
geekyrocketguy ·
John, thank you for this resource! It is really helpful.
Correction: the lens that’s been used to photograph this laser before was the Coastal Optics 60mm f/4 in Nikon mount, and not a Nikon-manufactured 60mm f/2.8.
I’ll email you shortly, Brandon.
Nikolai Vassiliev ·
Oh, great article.
I’ve discovered a few years ago that (i know it ‘in theory’ before) that one particular lens i use has not only coating and manufacturer colour ‘bias’ but clearly has particular lens element with colour cast. It’s special lens, old Sigma 12-24 – overall it has a common for 2000s Sigmas ‘brown’ cast but this one shows more ‘brown-yellow’ and more ‘cyan’ cast over frame and zooming/focusing. Visible via even optical camera viewfinder. Like thickest lens element works like a center filter.
Yes, it can be a well-known on Sony A7r sensor cast but happens on different SLR bodies i own/used (A900, A99, A7r, A7-II so far).
Søren Stærke ·
Funny. I started following this “blog” due to my interesse in photography, but more and more you are touching what my actual job is about: Imaging spectroscopy for sorting. Give me a pm if you want an article about hyperspectral imaging 😉
Roger Cicala ·
Soren, I’d love a link, thank you!!
Søren Stærke ·
I am sorry, the only links I have are for articles published in scientific potato journals. Our core business, but not so relevant in this forum.
However I do have a ton of data and explanatory images (Marketing always requests simple illustrative stuff) that I could merge into something more minded for people with a background in photography.
John Dowdy ·
Howdy Neighbor!
Nice setup, very interesting application.
If you want to see a gold standard comparison we could connect one of my breathtakingly expensive,relatively slow, spectroradiometers in place of your little CCD spectrometer.
Might be fun.
John C. Dowdy
http://scholar.google.com/citations?hl=en&user=3ubidXMAAAAJ&view_op=list_works&pagesize=100
Roger Cicala ·
Might be very fun, and at least for us very informative. Shoot me an email roger at olafoptical.com
Claudia Muster ·
Looking at these spectra, a question arises: What’s the point in adding an additional UV filter?
Athanasius Kirchner ·
Protecting the front of the lens from dust or liquids, I guess – it’s useless for other things.
S.Yu ·
The UV filter is from decades back when either old sensors (and/or film, can’t remember) would be exposed by strong UV rendering the image foggy, nowadays protectors are probably better, but the sturdier ones may be more expensive than a UV filter.
Athanasius Kirchner ·
Fascinating article, thanks!
It’s wonderful to see that Sigma lent you a hand as well. Yamaki-san has earned a lot of admirers among the gearhead community, and with good reason 🙂
Hank Roest ·
Terrific post again. And very nicely presented. But on behalf of David Byrne specifically and poetry generally the last quote is not “Where does this highway go?” but “Where does that highway go to?” 😉
Roger Cicala ·
You are correct, and I have corrected it. Because I have total respect for David Byrne.
CheshireCat ·
I greatly welcome this new test tool, as color in photography is more important to me than sharpness.
Great job ! Looking forward to reading more and more color-related articles.
KWNJr ·
The answer to the question: ” … are the spectra the same, or different?”;
Might better be phrased as “both … depending”.
Alkind ·
With a Eye One Pro (UV enabled) and plotting software already in use I thought that (to a degree) measuring the transmission of my vintage lenses was possible. Then I got to these pages and decided it was a project better not started. My goal was to get a insight of the color character of the lenses and possibly create profiles based on the spectral measurements if possible. Is the creation of profiles something that has been considered too when you started this project? I would estimate it to be somewhere between using a monochromator and color target profile creation. It would need data of the sensor too then but might build on top of that data.
Cenxi Wang ·
https://uploads.disquscdn.com/images/d7f01e52cd54205c4958b03cfcf6b7d605a6ab58d7862729987ab6b002652b0f.png Hi Roger, this curve looks smooth. I'm wondering it comes from which lens?