Lenses and Optics
Variation Measurements for Telephoto Lenses
We’re nearing the end of the Varation series for prime lenses. If you are joining in late, you may want to go back to the original article for an introduction into the methods used. Today will look at the short telephoto group, lenses ranging in focal length from 85mm to 150mm. We’ve also included a summary table of all the lenses we’ve tested to date at the end of the article.
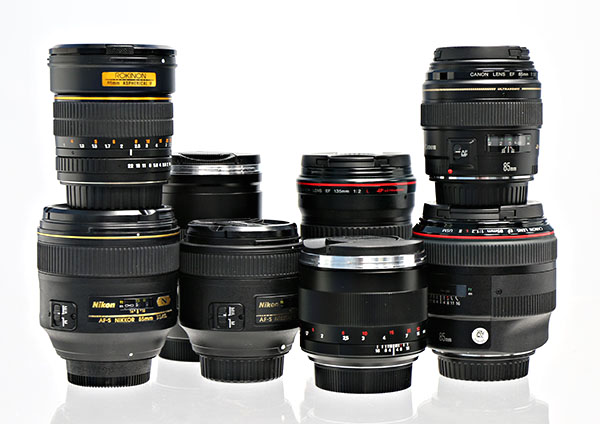
Today’s lenses are somewhat of older design, with several models released in the 1990s. The prices range from $400 to $4200. My own assumption (and we all know how well my assumptions usually turn out) was that these longer lenses would have less copy-to-copy variation than the wider focal lengths did.
MTF Curves of Telephoto Lenses
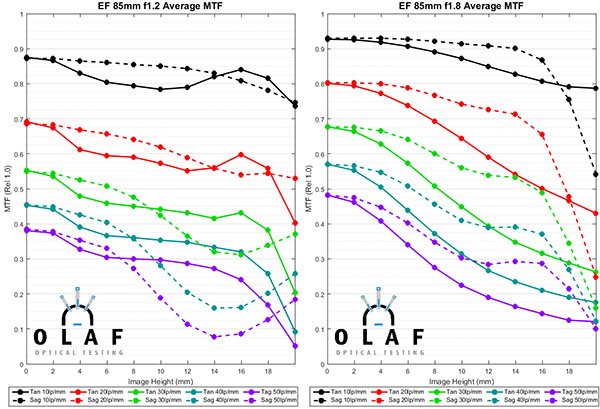
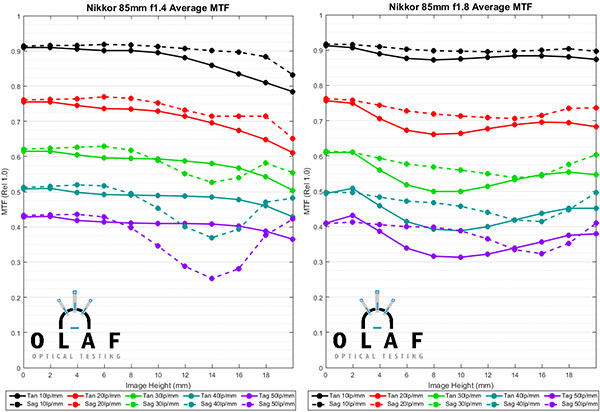
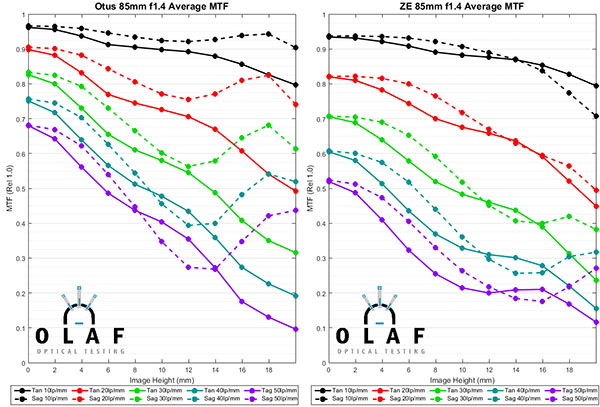
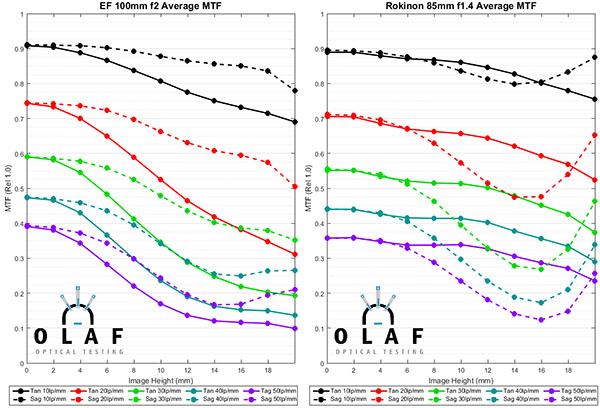
Ten copies of each lens were tested on our Trioptics Imagemaster Optical Bench using the standard protocol, which we described in the introductory blog post. All lenses are tested at their widest apertures, so take that into consideration when comparing MTFs; stopping down a lens would improve its MTF, so consider that when you compare an f/1.8 lens to an f/2.8 lens or whatever. These are presented roughly in order of widest to longest.
- Roger Cicala and Brandon Dube, Lensrentals.com, 2015
Roger Cicala and Brandon Dube, Lensrentals.com, 2015
- Roger Cicala and Brandon Dube, Lensrentals.com, 2015
- Roger Cicala and Brandon Dube, Lensrentals.com, 2015
Before you all go crazy over the Canon 85mm curves, remember that f/1.2 is significantly wider aperture than f/1.4. Also remember the Canon 85mm f/1.8 and 100mm f/2 lenses are ancient (1991-92) designs. The Nikon 85mm lenses are much more recent, released in 2010 and 2012 respectively and it shows in their resolution. They are excellent from center to edge. The Zeiss 85mm f/1.4 is particularly good in the center, where it has significantly higher resolution than even the Nikons, but not as good off axis. The 85mm f/1.4 Otus, of course, is just amazing optically, with easily the best resolution in the center and excellent resolution to the edges, although it does have significant astigmatism in the outer 1/3. The Rokinon 85mm f/1.4 shows again that Rokinon makes some lenses that are nearly as good as the brand-name lenses at very low prices.
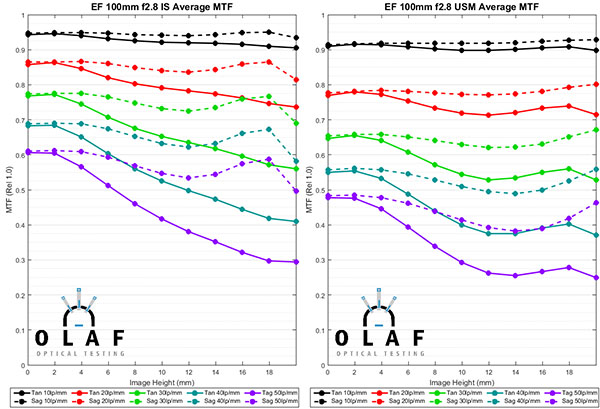
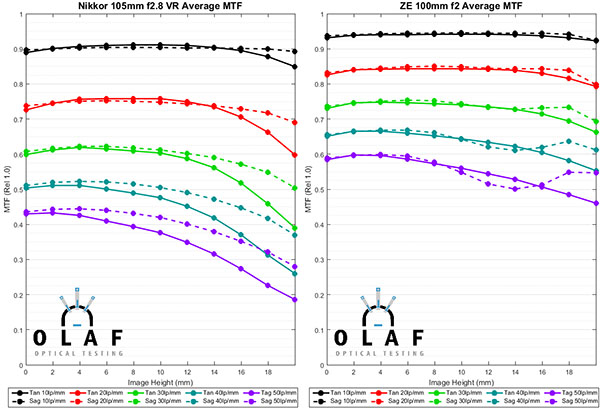
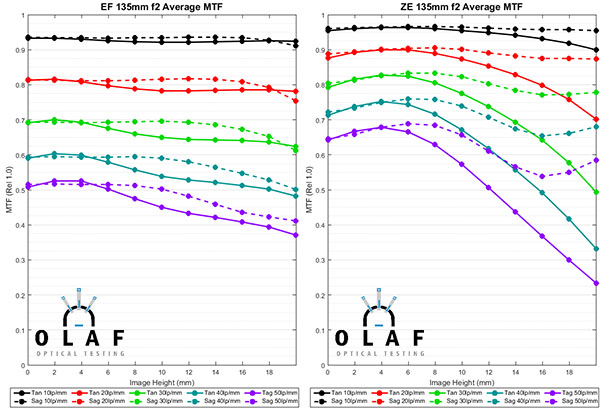
I separated the MTF curves for the Macro and 135mm lenses, since they are really quite different beasts than the 85mm lenses.
- Roger Cicala and Brandon Dube, Lensrentals.com, 2015
- Roger Cicala and Brandon Dube, Lensrentals.com, 2015
- Roger Cicala and Brandon Dube, Lensrentals.com, 2015
Looking at the 100 range Macro lenses, it’s apparent that the Nikon 105 f/2.8 VR Micro and Canon 100 f/2.8 Macro are excellent, but don’t resolve quite as well as the other two Macro lenses. This isn’t too surprising; they are both older designs. The amazing thing to me is just how excellent the Zeiss 100mm f/2 Makro Planar is; it compares very well with the new Canon 100mm f/2.8 IS L, even though the Zeiss is being tested at f/2 and the Canon at f/2.8. That is really amazing.
I would point out, though, that this is testing at infinity focusing distance. As we know, Macro lens performance can be quite different at macro shooting distances.
The Canon 135 f/2 L is a superb lens, one of my favorites. But there’s not much question if you don’t mind lugging around the weight, paying the price, and manually focusing, the Zeiss 135 f/2 gives you higher resolution except at the edge of the image.
Copy-to-Copy Variation
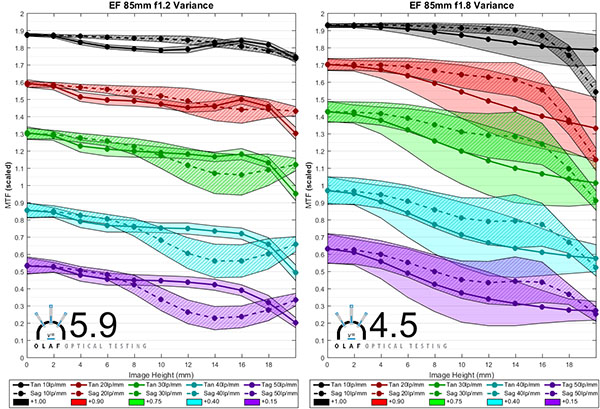
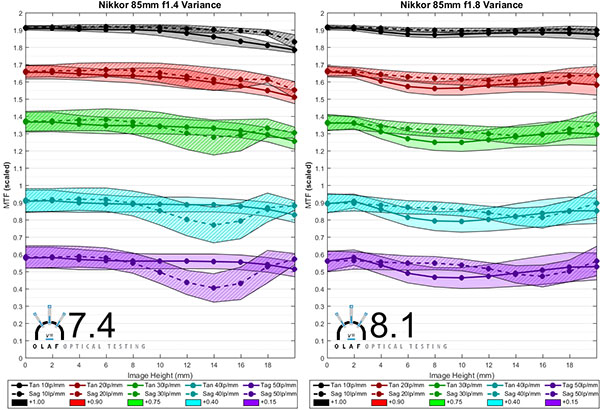
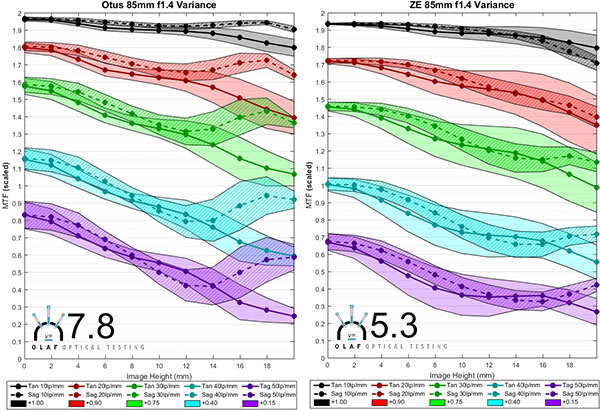
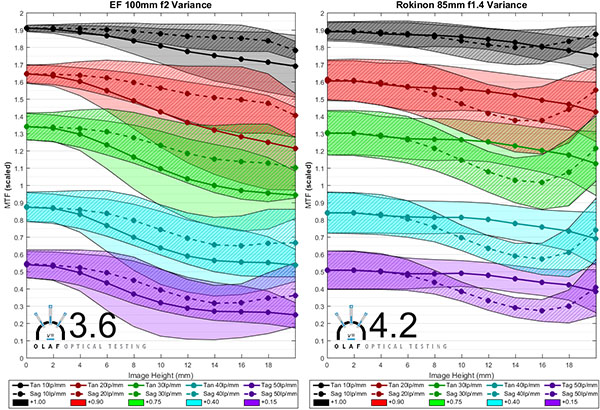
The simplest way to look at variation is with our Consistency number (for a complete discussion of how we arrive at the Consistency number, see this post). In summary, a higher consistency number means there is less copy-to-copy variation; the lens you buy is more likely to closely resemble the MTF average we presented above. In general, a score over 7 is excellent, a score from 6-7 good, 5-6 okay, 4-5 is a going to have significant copy-to-copy variation, and under 4 is a total crapshoot.
Our expectation was that the telephoto lenses would have less sample variation than the wide-angle lenses. Here are the variation graphs in the same order as the MTF charts above.
- Roger Cicala and Brandon Dube, Lensrentals.com, 2015
- Roger Cicala and Brandon Dube, Lensrentals.com, 2015
Roger Cicala and Brandon Dube, Lensrentals.com, 2015
- Roger Cicala and Brandon Dube, Lensrentals.com, 2015
The most consistent of the 85mm lenses are the two Nikons along with the Zeiss Otus. The Canon 85 f/1.2 is, of course, an f/1.2. Its optical assembly is basically a single unit; no adjustments are possible as far as we know. The other two Canon lenses are much, much older design and probably designed more towards film tolerances, which would be less critical than that needed for digital sensors. Still, my theory that longer focal lengths would have less copy-to-copy variation takes a pretty big hit here.
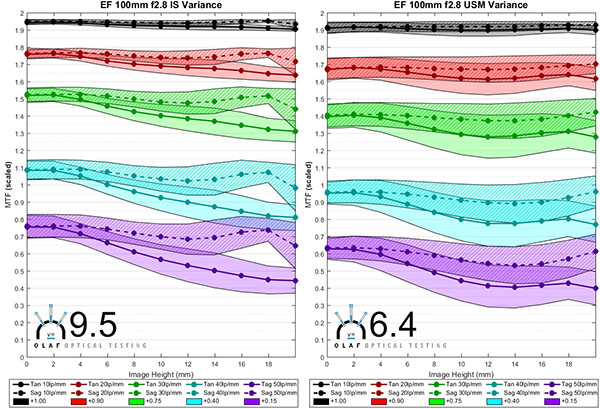
- Roger Cicala and Brandon Dube, Lensrentals.com, 2015
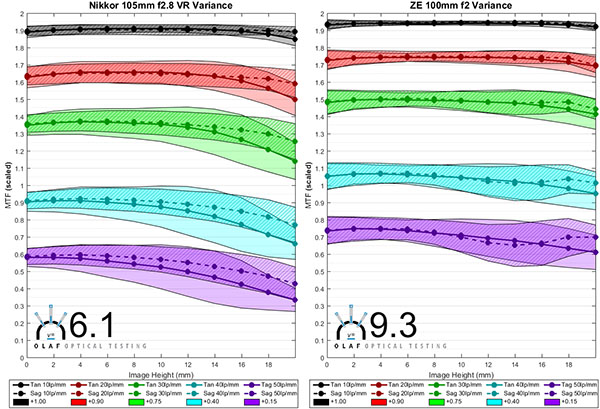
- Roger Cicala and Brandon Dube, Lensrentals.com, 2015
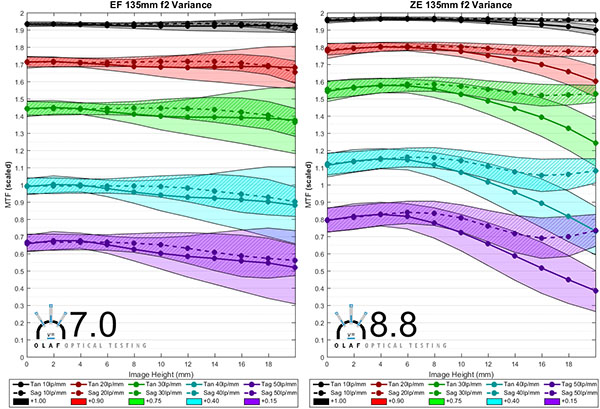
- Roger Cicala and Brandon Dube, Lensrentals.com, 2015
The longer focal lengths do seem to have less copy-to-copy variation. The older designs of the Canon 100mm f/2.8 Macro and Nikon 105 VR Macro aren’t quite as good as the others. The newer Canon 100mm f/2.8 IS L Macro and the Zeiss 100mm f/2 Makro are just excellent, with some of the highest Consistency numbers of any lenses. The 135mm lenses are also both very good, although the older Canon design isn’t as good as the new, and much more expensive, Zeiss 135mm Apo-Sonnar.
Updated Table
I’ve updated the sortable table of consistency scores by brand, focal length, and aperture and reproduced it below. If you want to look at the variables differently, you can click on any of the headings and sort things by that category.
Manufacturer Focal Length (mm) Aperture Consistency
Rokinon 24 1.4 4.0
Nikon 24 1.4 4.6
Sigma 24 1.4 4.9
Canon Mk II 24 1.4 6.3
Canon 50 1.2 6.0
Canon 50 1.4 5.5
Canon STM 50 1.8 9.3
Nikon 58 1.4 6.7
Nikon 50 1.4 4.6
Nikon 50 1.8 6.3
Zeiss 50 1.4 6.1
Zeiss Makro 50 2 7.3
Zeiss Otus 55 1.4 6.5
Sigma Art 50 1.4 7.5
Rokinon 50 1.4 4.0
Canon Mk II 14 2.8 4.0
Rokinon 14 2.8 4.0
Zeiss 15 2.8 6.5
Zeiss 18 3.5 6.1
Canon TS-E II 24 3.5 5.3
Canon TS-E 17 4 4.9
Zeiss 21 2.8 5.2
Zeiss 25 2 6.2
Canon IS 24 2.8 5.9
Canon 28 1.8 6.0
Canon IS 28 2.8 9.3
Canon 35 1.4 6.6
Canon IS 35 2 7.7
Nikon 35 1.4 5.9
Nikon 35 1.8 4.5
Zeiss 35 1.4 5.7
Zeiss 35 2 6.4
Sigma Art 35 1.4 5.1
Rokinon 35 1.4 3.6
Canon 85 1.2 5.9
Canon 85 1.8 4.5
Rokinon 85 1.4 4.2
Nikon 85 1.4 7.4
Nikon 85 1.8 8.1
Canon 100 2 3.6
Zeiss 85 1.4 5.3
Zeiss Otus 85 1.4 7.8
Canon Macro 100 2.8 6.4
Canon Macro IS L 100 2.8 9.5
Nikon Micro VR 105 2.8 6.1
Zeiss Makro 100 2 9.3
Canon 135 2 7.0
Zeiss 135 2 8.8
Variation Sumary
I had planned another post showing good predictors of copy-to-copy variation with a bit more in-depth analysis. The truth is, the summary doesn’t require another post. There are some trends, but nothing that serves as a nice, general, overall predictor of which lenses have little copy-to-copy variation. There are a few things worth noting though.
I hate to get into brands because it makes the fanboys go insane, but there are a couple of trends that are pretty obvious when you sort the table above. Zeiss lenses overall do better than the others; no Zeiss lens falls below “5” on our scale, and the vast majority are over “6”. Canon’s newer lenses are also superb, with very high consistency scores, and several of these are of the reasonably priced variety. Rokinon lenses are at the lower end of the consistency scores, which is entirely understandable. These are superb optics made at an amazingly low price. Achieving that low price means not having adjustable optics and taking some cost saving measures. They’re still awesome bargains and I shoot several of them myself. Copy-to-copy variation is pretty understandable at that price.
Second, it seems we probably should put an ‘aperture adjustment’ constant in our formula, or at least emphasize more that wider aperture is going to have more variation. The trend isn’t very strong, but there is some correlation that f/1.4 lenses have more variation than f/2 or f/2.8 lenses. Before we decide why that might be, though, we need to look at variation of a group of f/1.4 lenses as we stop them down. I don’t know how much of the variation is from shooting at a wider aperture itself and how much is the more complex design required to get a lens to that wide aperture. I suspect it’s a design thing, though, because some wide-aperture lenses have very little variation.
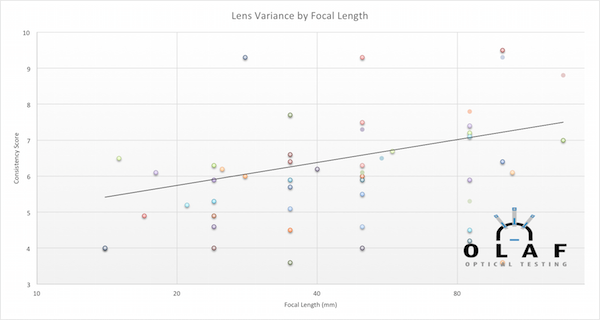
The most favorite internet theory, that more expensive lenses have some magic ‘quality control’ that eliminates variation, is totally untrue. The trend line for that is just about flat. If you’re surprised don’t be. Money goes into multiple elements, more expensive glass, and complex designs. The lenses get made in the same factory, generally, and tested with the same equipment as that company’s other lenses. Actually, the QA probably has to be a bit better just to keep the variation the same. More complex lenses, designed to tighter tolerances, will normally have more variation, not less. Tighter QC is probably needed just to keep variation the same.
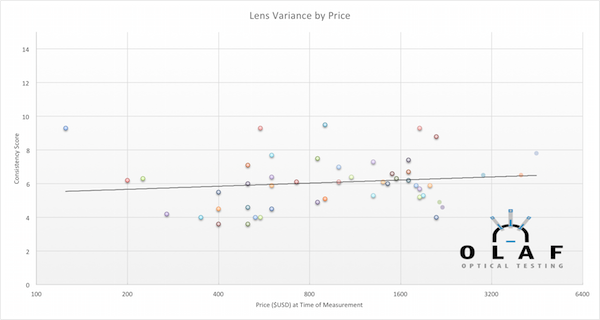
Overall, year of design didn’t have a lot of impact either. But we did see that new Canon lenses seem to be doing much better. When you sort the table above, it’s clear that there are several new Canon designs at the top of the consistency scores. We’ve also been noting for several years the increased modularity in Canon’s lens designs when we do lens teardowns. I suspect the two trends are related.

But at this time, there’s not much that can be done to predict how consistent the copy-to-copy variation in a given lens will be. We’ll just have to keep testing it.
Roger Cicala and Brandon Dube
Lensrentals.com
July 2015
ADDENDUM
Our MTF and Consistency graphs are now available in a comparison tool at The Digital Picture. You can use their lens comparison tool to compare any two lenses that we’ve done, and will update their site as we do more. I think this is amazingly useful compared to searching through our blog posts to find what you are looking for. We appreciate Bryan and the staff at TDP for doing all the heavy lifting to make this possible.
Author: Roger Cicala
I’m Roger and I am the founder of Lensrentals.com. Hailed as one of the optic nerds here, I enjoy shooting collimated light through 30X microscope objectives in my spare time. When I do take real pictures I like using something different: a Medium format, or Pentax K1, or a Sony RX1R.
-
Florian
-
Andre Y
-
Jim Thomson
-
JGro
-
winc06
-
SSL
-
nhz
-
Martin_MM
-
ARPL
-
Andre Y
-
Carol Teater
-
Andre Y
-
Brandon
-
Andre Y
-
Randy
-
Brandon
-
Brandon
-
Andre Y
-
Anton Berlin
-
Brandon
-
James Thomson
-
Anton Berlin
-
Brandon
-
CarVac
-
Brandon
-
Larry
